Evolutionary Mismatches
A fun little “side” project
Often, there are discussions around what is the best way to create a phylogeny to capture the evolution of say, a genera. Do you use a single gene as a marker, or concatenate genes together, or some other technique?
Viruses, especially small ones, are great to work with from a bioinformatics standpoint - genomes are not insanely large, minimizing complexity/computational resources, and are widely available in sequencing data etc. My thesis revolves around one of these viruses - the Papillomaviridae (PV) family to be precise - using them as a sort of pilot experiment for Logan.
In the PV field, species are demarcated by their L1 gene, which codes for the major capside protein. This gene is quite nice as far as marker genes go, as they are composed of high conserved, common structures. Hence, I have been using this gene to do my accounting of PV diversity - if something is more than 10% different in terms of nucleic acid identities, then it counts as a new “species”, as classically considered in the field - or at least creates an arbitrary unit in which to compare everything against evenly.
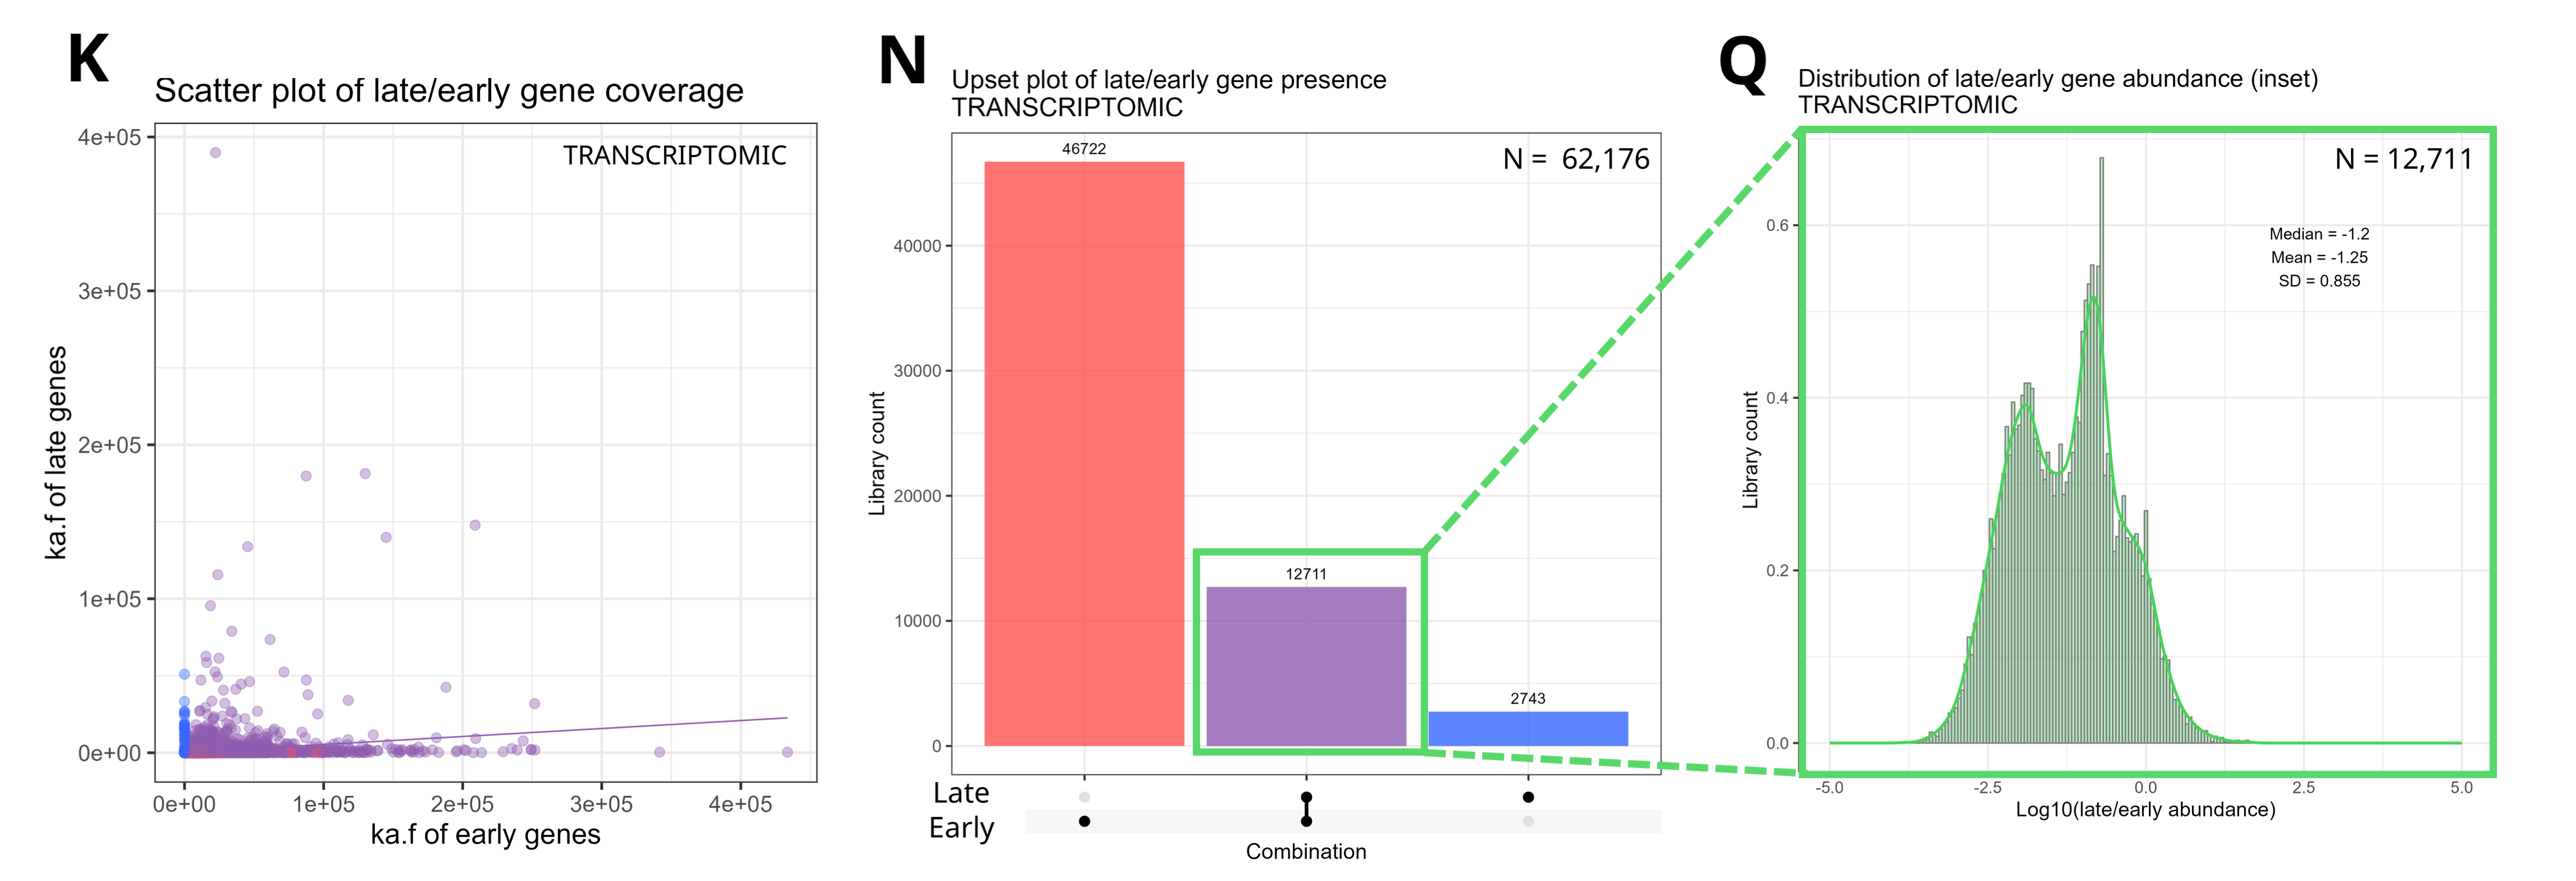
This works great, in the case where a full genome, or at least the L1 + some other gene of interest is found, as it creates an anchor to which you can “assign” these sequences to. However, real life is not quite as neat, and you get cases of “no L1 + lots of other genes”. This is likely due to the biological quirks of this virus, as the expression of each gene is highly temporally controlled throughout it’s replication cycle.
This is not so much of an issue in DNA sequencing libraries, where the dsDNA genome of the virus is expected to be sequenced with relatively even coverage throughout. However, in RNA-based libraries, there is a pattern of picking up more early genes. This is likely because most PVs will hang around latent, in the basal layer of the epidermis, expressing their early genes to maintain virus presence there. It is much more rare for an “active” infection, at the top cornified layers, and thus the expression of the late genes as well.
Another representation:
So, how do you then characterize these orphan genes? I suppose it doesnt really matter in the grander picture of recording diversity, but it is important from the perspective of: “If we see one of these orphan sequences, what are the chances that it belongs to the equivalent of a new species (and thus represents some new diveristy that had not previously been described)?”. Especially pertinent in the type of testing that we are doing now, which is synthesizing some of these early genes and testing them for tumor potential. How do we know that we are capturing the entire diversity of these genes present in PV species?
The idea is to first capture the expected diversity of these early genes expected compared to the L1 gene. This goes back to the idea of each gene having its own evolutionary path, where we can expected genes that are very necessary for survival (think the 16srRNA in bacteria) are going to evolve much slower - the idea is that any alteration in this sequence that impacts the function is going to have very severe consequences. On the other hand, some genes that are a bit less necessary such as, say, antibiotic resistance genes, has the freedom to evolve and try out new things, without being certain death for the organism. This is the case for PVs as well, with the “accessory genes”, such as E5, E6, E7, have more diversity compared to the necessary E1, E2, L1, L2. So, you can find a rate of evolution between gene, such as every 1 amino acid substitution in the L1, we expect 2 in the E6 gene.
This then provides a rough solution to the problem. If we find a E6 gene with 6 amino acid substituions compared to all other known ones, then we can assume that this E6 belongs to a new species that we don’t have the information on. This can be done on large scale, essentially comparing all L1s against all E6s and generating a rate of evolution, as such.
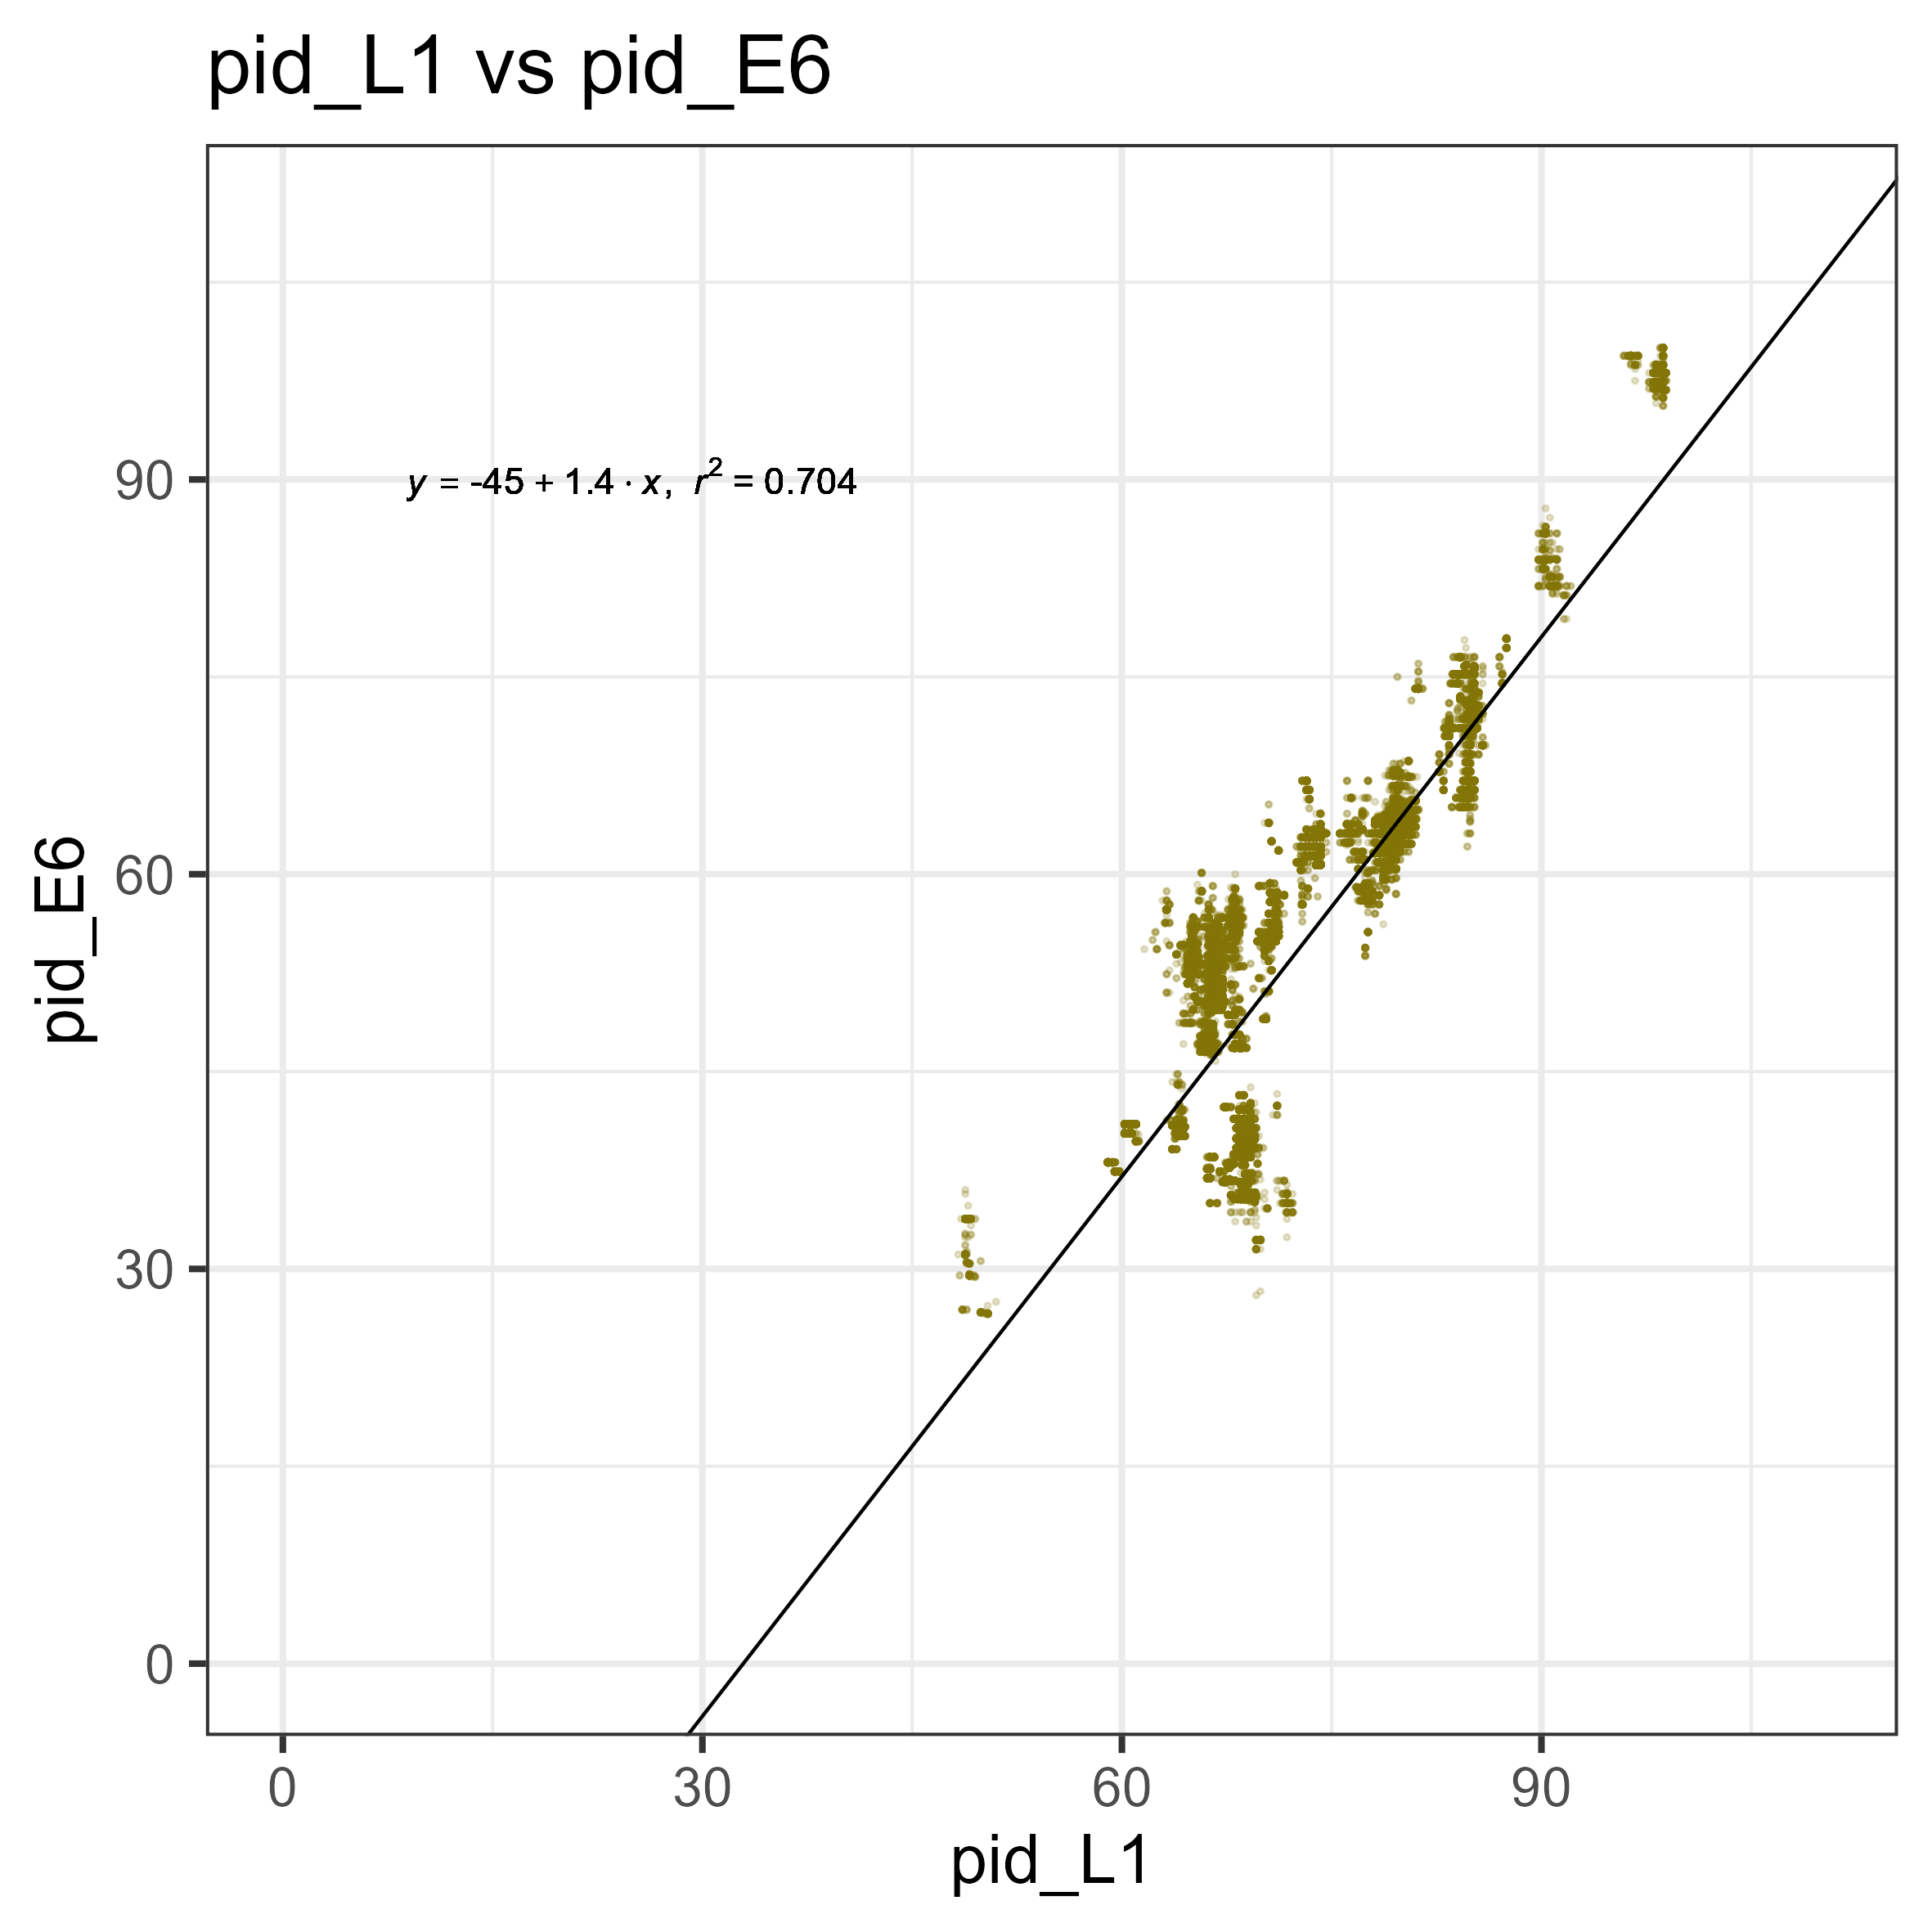
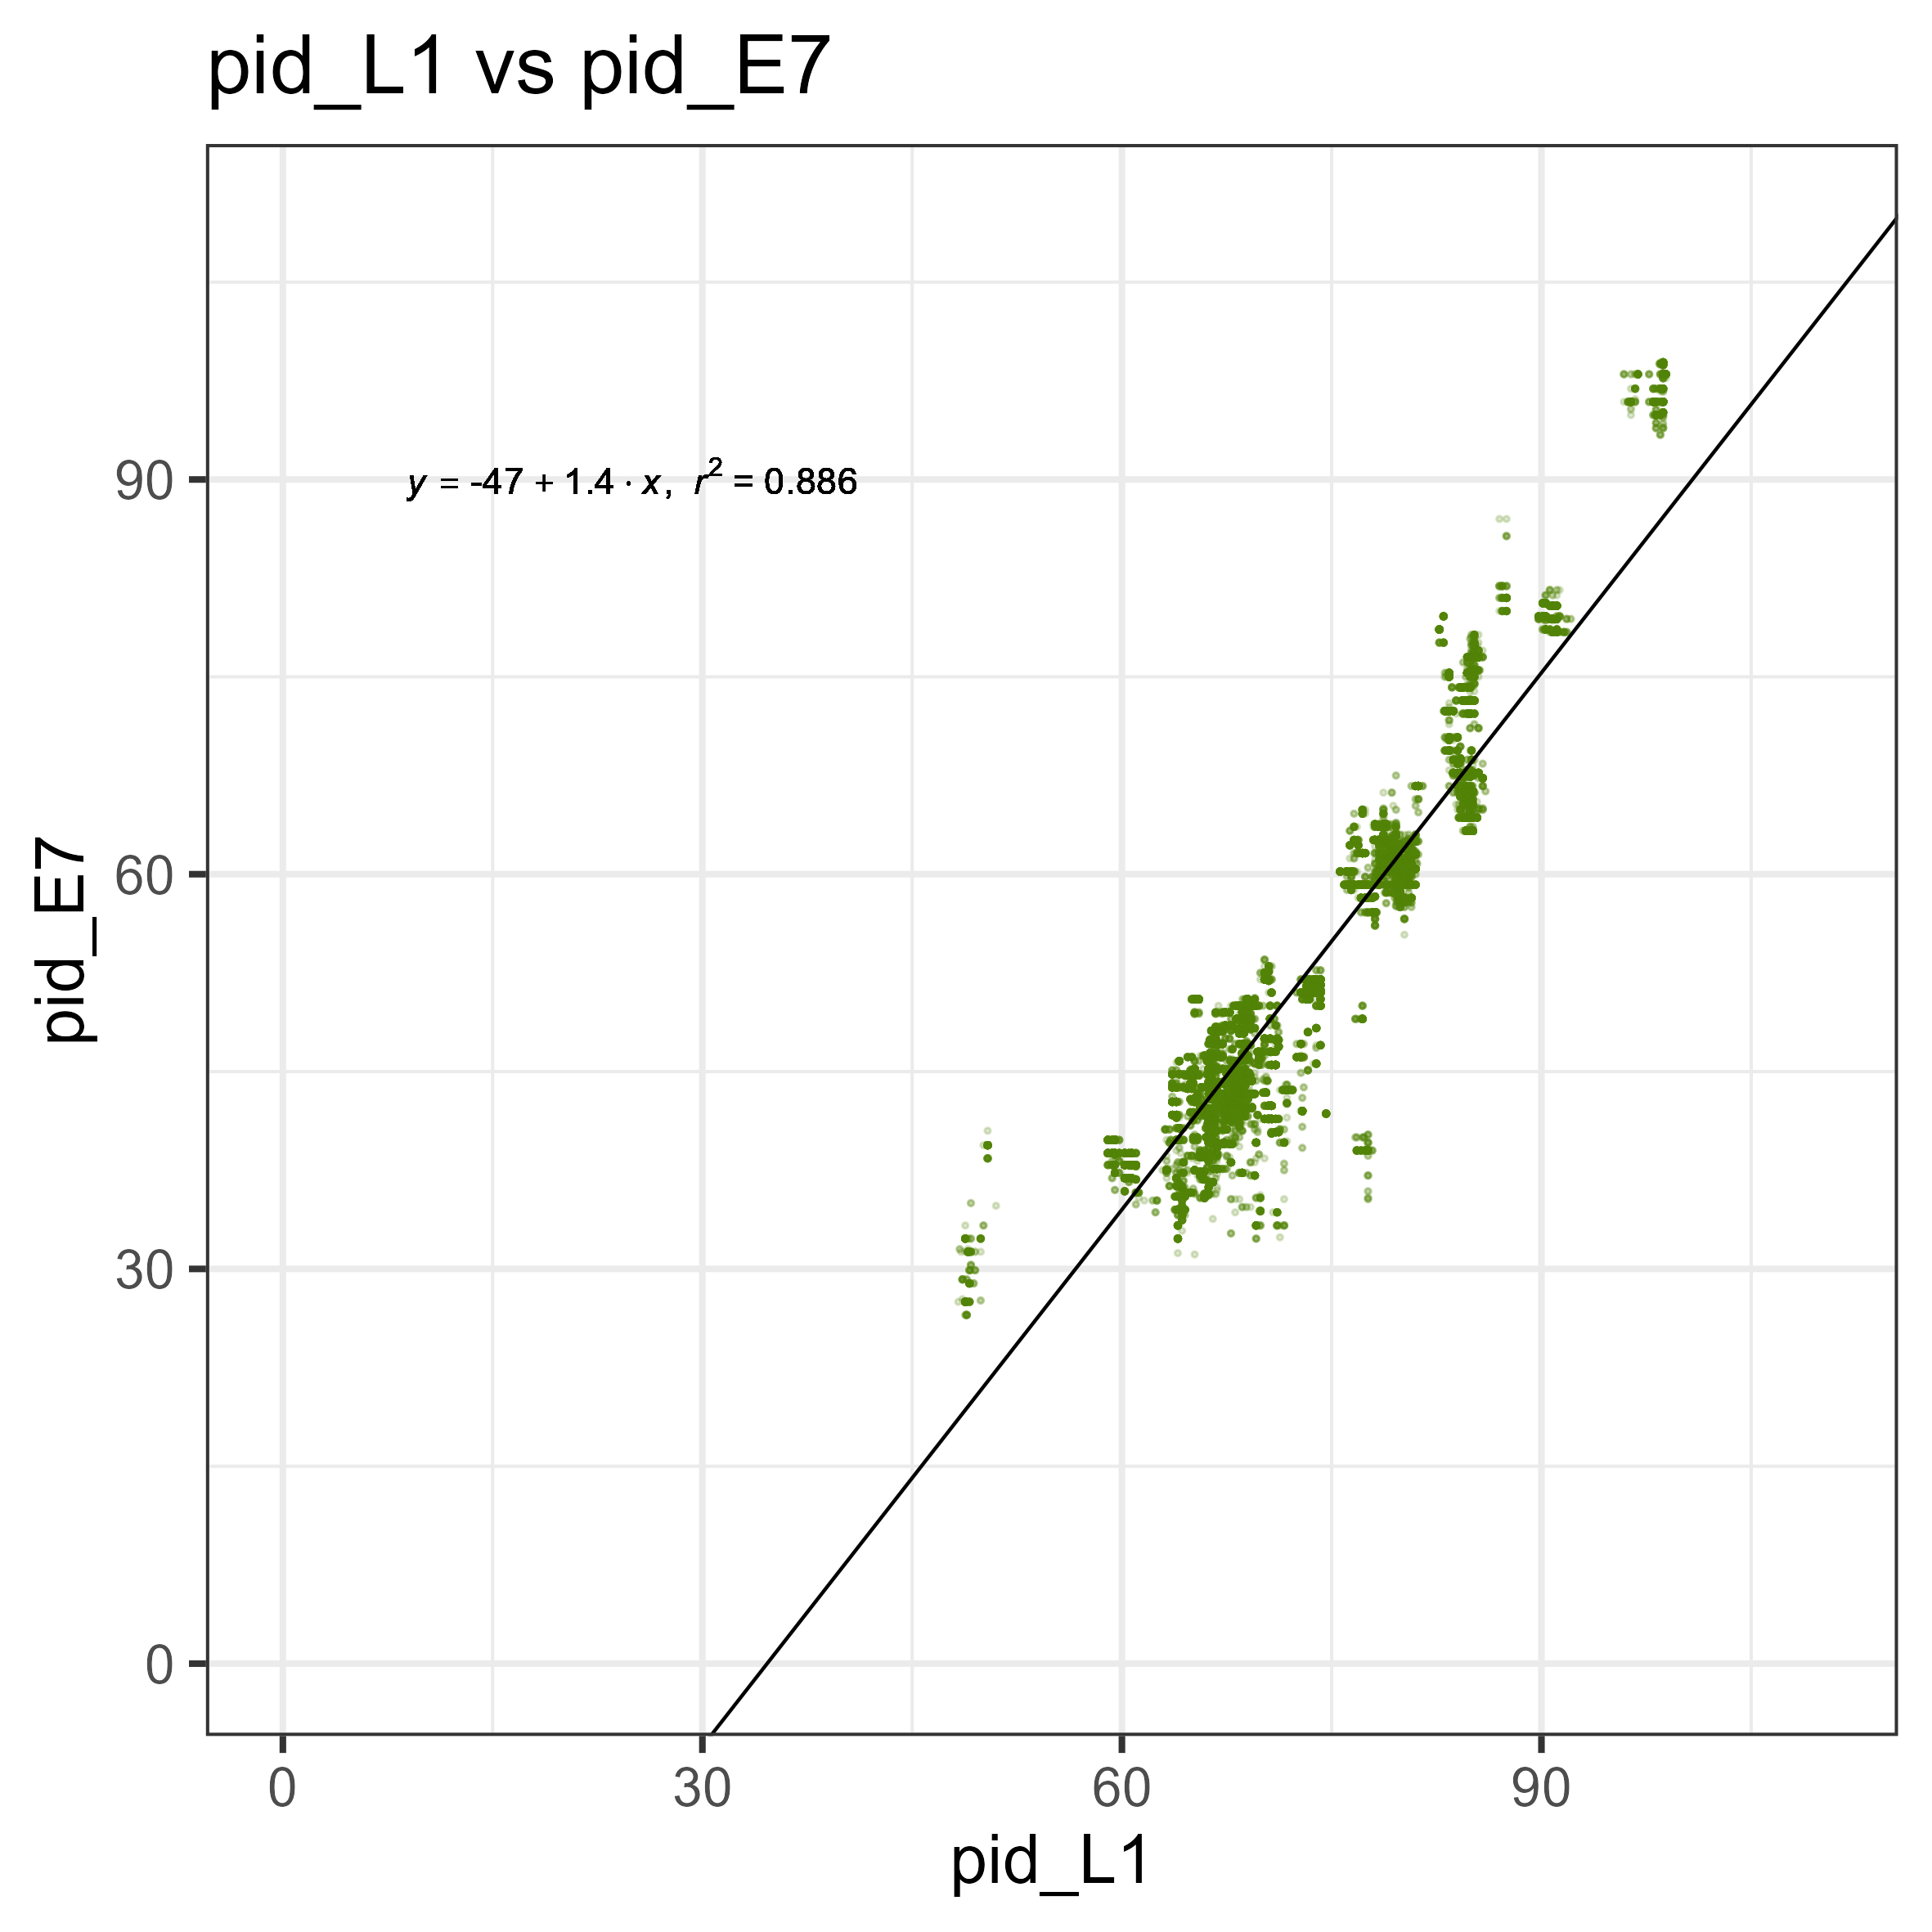
Nice! Now, for any new E6 or E7, we can make an assumption of whether or not it belongs to a new species of PV. But there is something interesting there! Look at the L1 vs E6 graph - there is a strange pattern of a group, where for a given L1, the E6 is more diverged compared to all the other points. This also isn’t present in the E7 graph, meaning that this is likely a biological signal unique to E6s.
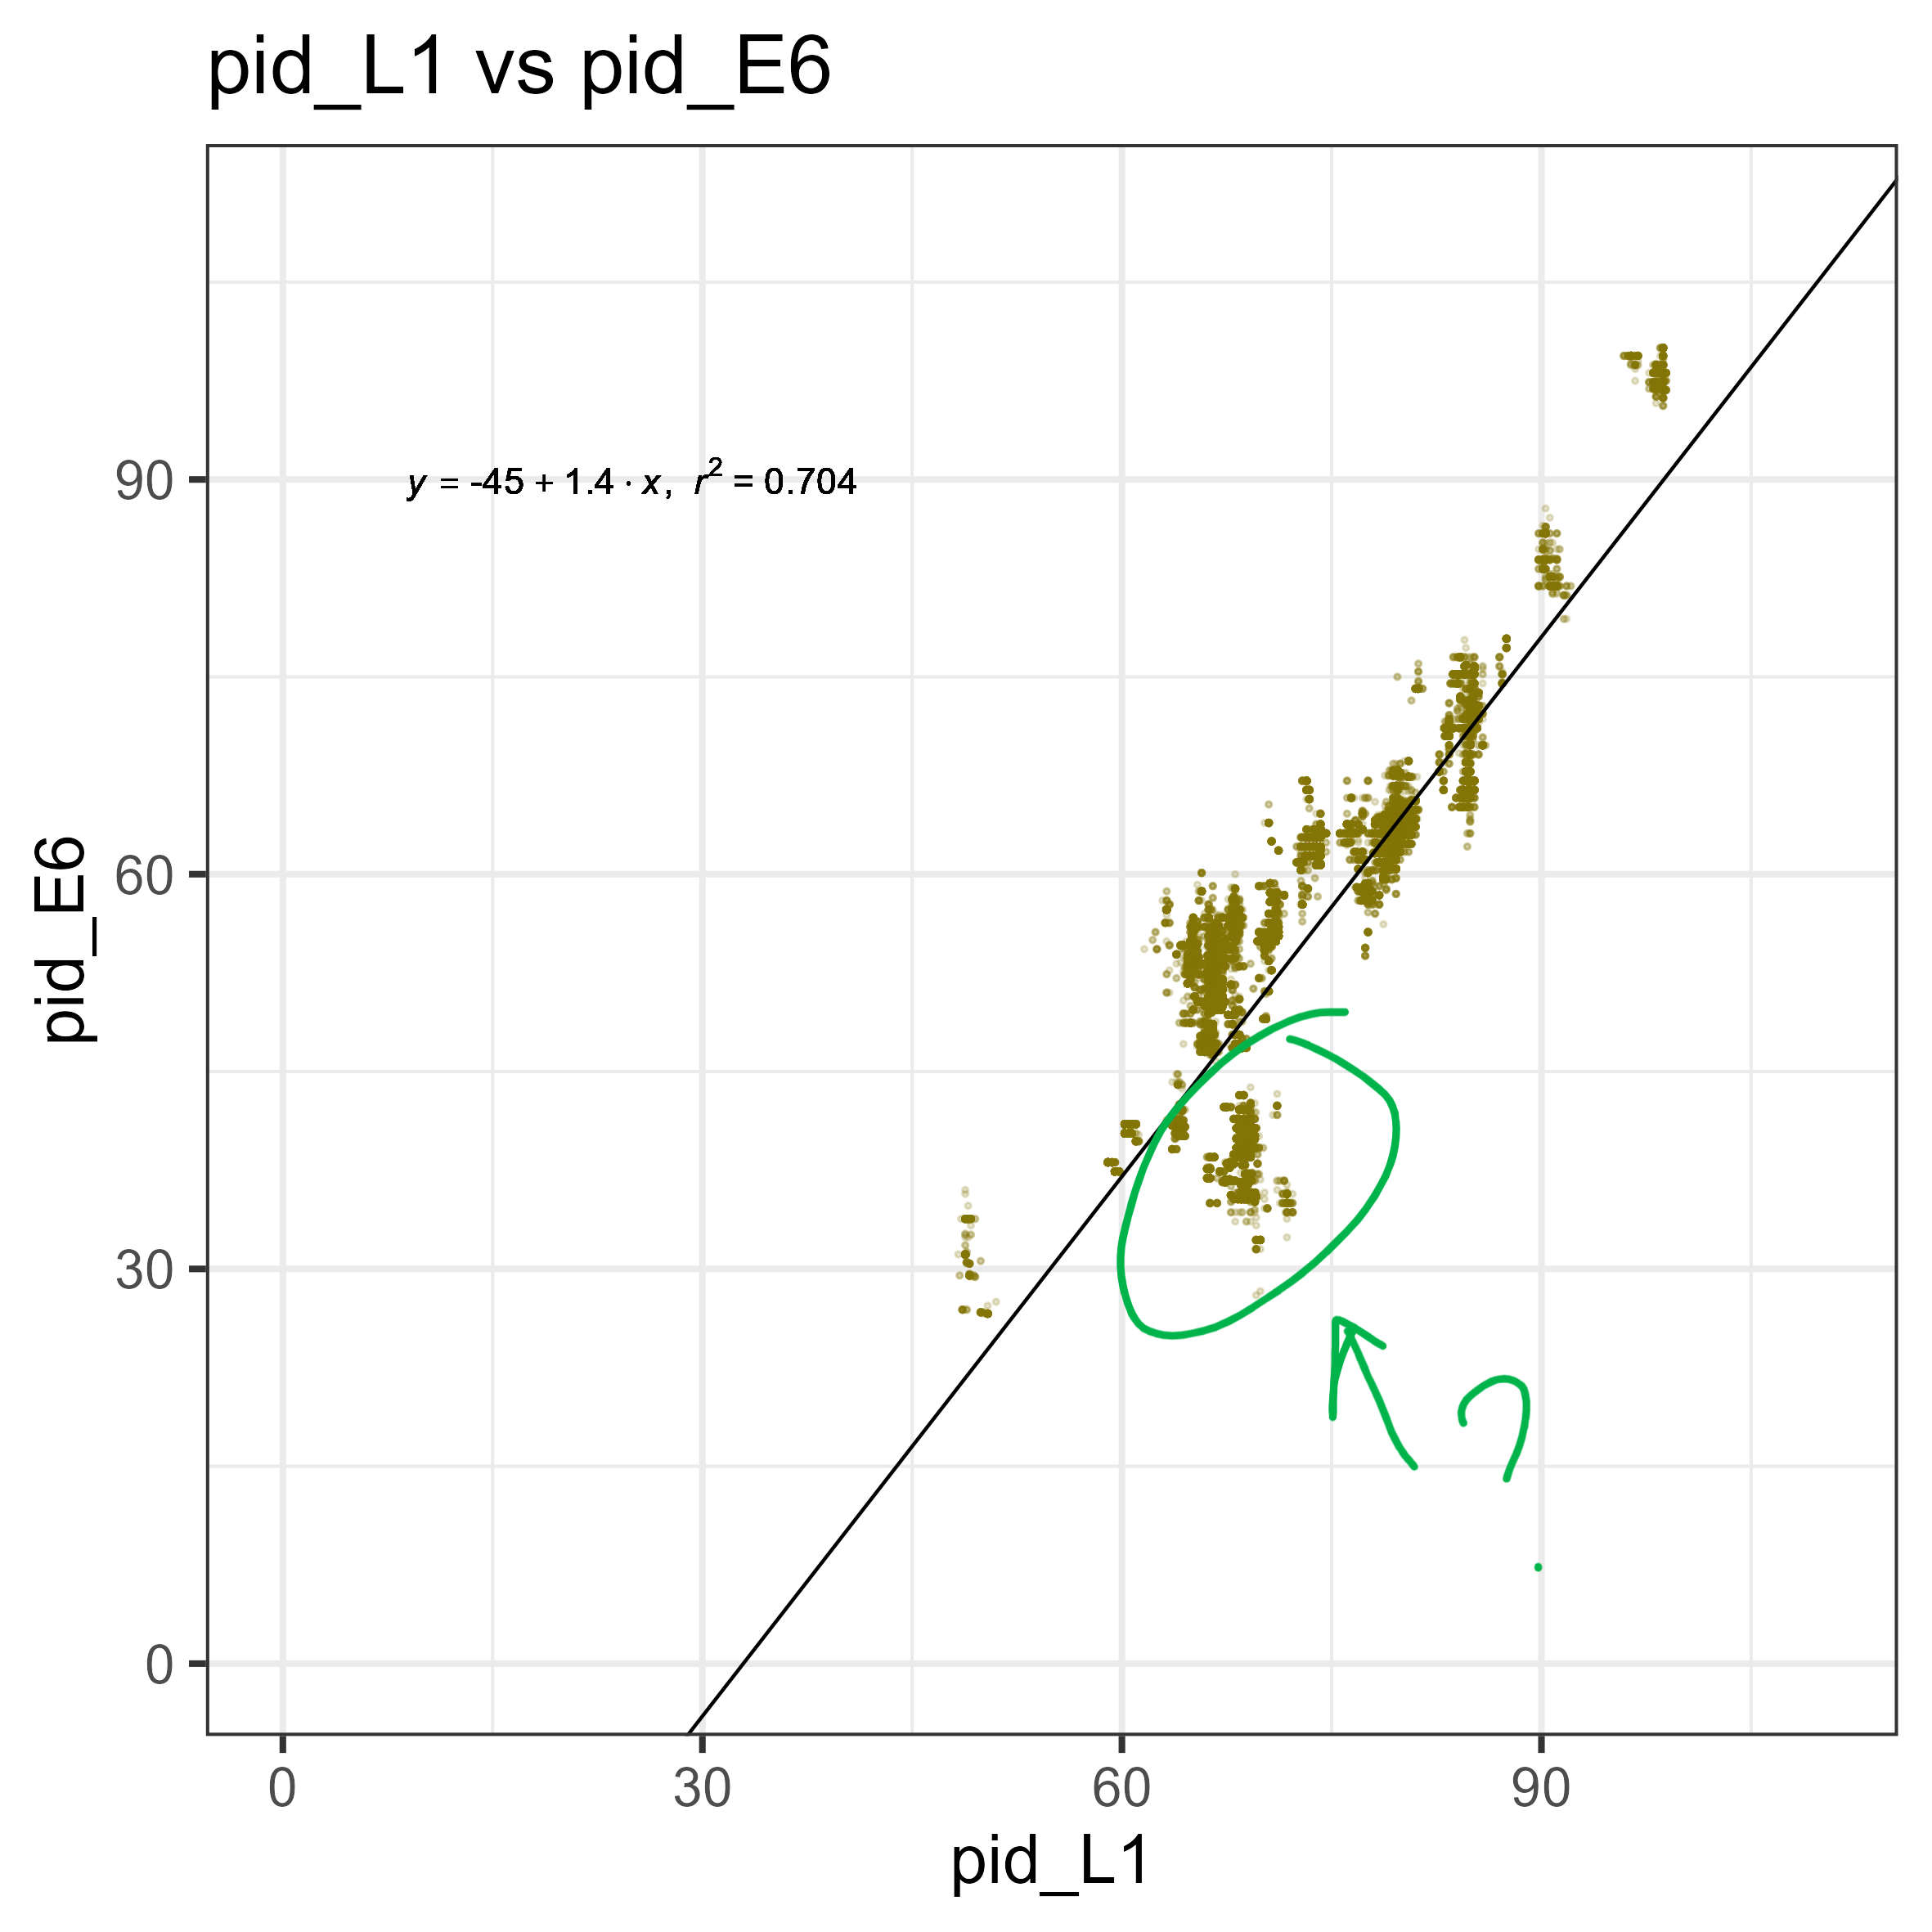
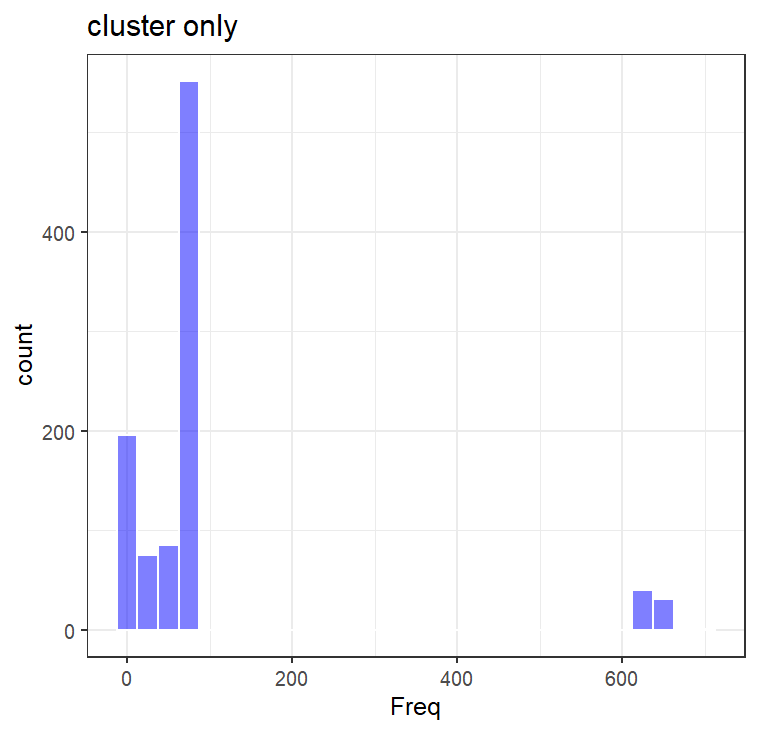
I investigated this, looking at the unusual group there. As each point is a comparison (one point = PVa E6 – PVb E6 and PVa L1 – PVb L1), it is hard to tell which of those points is the one that is contributing to the unexpected E6 identity ( is it PVa, or PVb?). A quick-and-dirty way of finding this out is by looking at what pairs are present in the “cluster” of interest (in blue square). As each point should be a comparison of (a-b, b-c, c-d, a-c, a-d, b-d…) I would expect that the ones that show up more often (a-b, a-c, a-d…) would then be the ones contributing to the lower cluster.
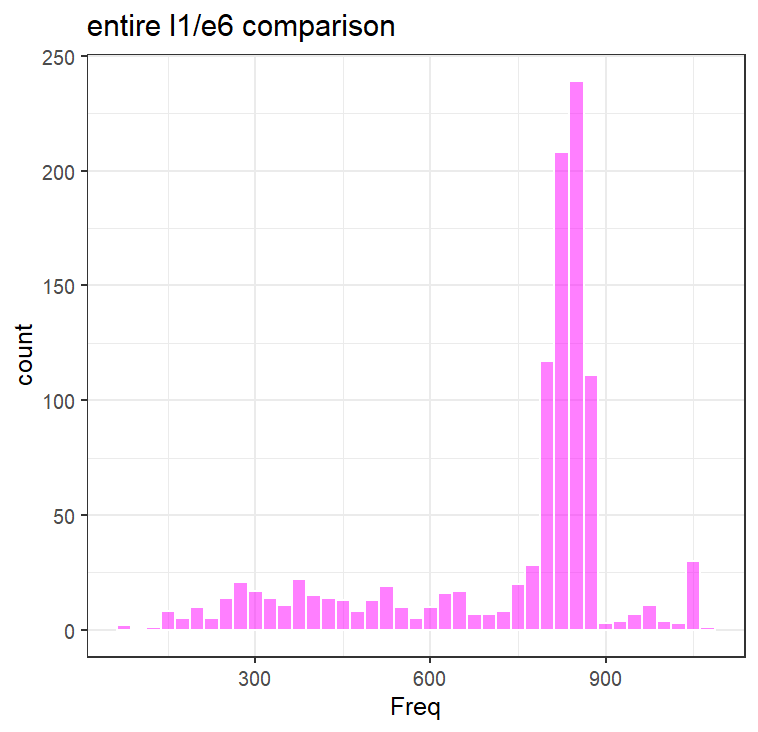
To do that, I compared the distribution of libraries (e.g., a, b, c, d, e…) over the entire scatterplot. To interpret this, think of each bar below as a representation of how many libraries show up X amount of times. For example, over the entire plot, the majority of libraries show up 800 times (as components of comparisons). If you plot only the cluster of interest, most terms only show up <100 times, while a small subset show up >600 times. These highly “prevalent” terms/libraries, are the likely the ones that are contributing to the cluster (e.g., a-b, a-c, a-d, a-e).
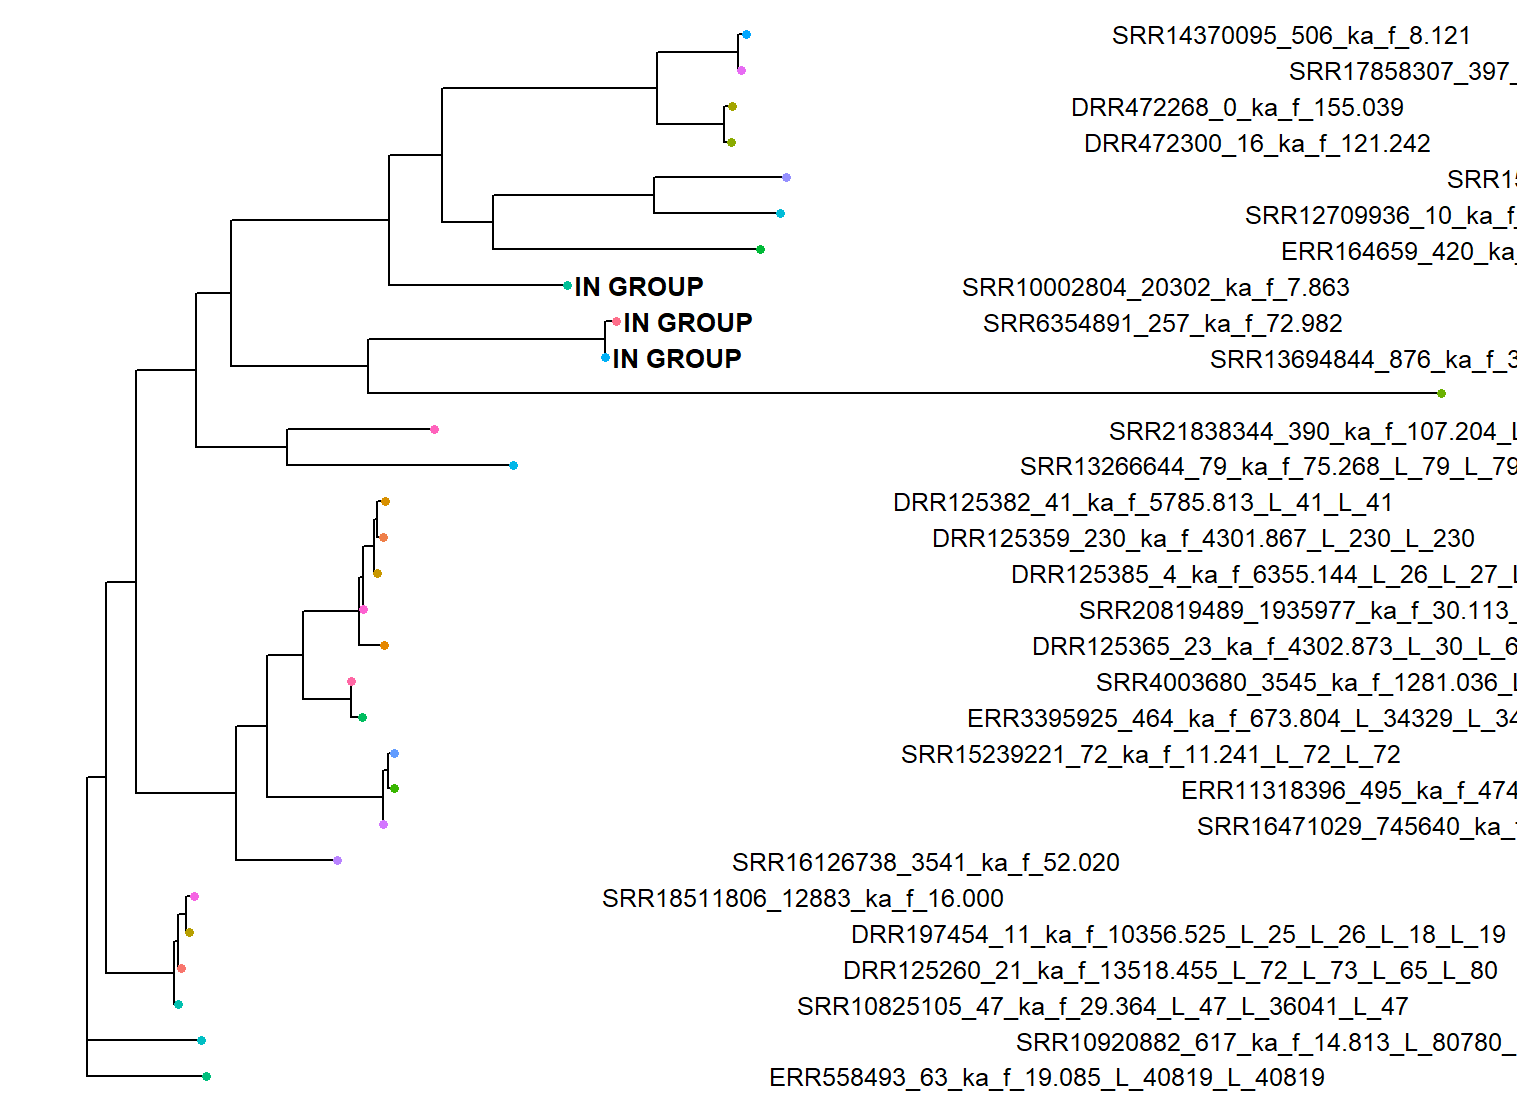
Generating a reference phylogenetic tree of E6 and L1 amino acids, clustering to reduce redundancy, and annotating the location of these prevalent terms, they are located in the tree and closely related. These libraries are annotated to be from a subway metagenome, and two vaginal swabs (so thankfully not an artifact of amplicon sequencing). BLASTP searches of this cluster show up consistently as HPV 91. It seems that HPV 91 specifically has a more diverged E6 compared to the rest of the PVs I looked at. Interesting.
A brief search of the literature shows that in the paper where this PV was discovered, the authors actually found that there was an expectedly high rate of evolution in another one of the PVs they uncovered, specifically HPV71. This anomaly is a cool little finding, in my opinion :)
July 17, 2025 JS