The Eco-geo-socio-techno-bio-logical interpretation of the SRA
Preface:
Q: What is the Sequence Read Archive?
A: The Sequence Read Archive (or SRA) is a giant database hosted by the National Institutes of Health to store high throughput sequencing data in a way that is accessible to the public. Raw sequencing data (think 250 nt reads) and alignment information as a way to promote reproducibility (the core tenet of science!).
Q: What are you guys even doing?
A: One of our main projects at the moment is trying to figure out what we can do with Logan, which is basically a re-assembly of all the short read data in the SRA (which is not computationally tractable for biologically-relevant analysis due to volume and redundancy, more details in preprint). This re-assembly from short reads to longer contigs gives us useful biological information from every dataset that was uploaded - of great interest is the peripheral data usually contained in the sequencing. You can’t eat fried chicken before an environmental DNA sequencing study without getting some chicken genome in there (source: personal anecdote from a previous supervisor)!
If you are interested in learning more about the fundamentals of sequencing, and how that data is made useful, see here.
Q: So you have all this data - what’s the big problem? Isn’t this what every scientist dreams of?
A: Yes, and no! I love all the data, but we’ve gone so far into the “we have data end” that we’ve now looped around into the “we can’t possibly analyze all of this without some creative solutions!”, which is what a lot of us are trying to solve right now.
Q: So what’s the biggest problem?
A: Metadata. Due to to the nature of the SRA, authors have a lot of freedom to choose what and how they include in their library accession (which is then attached to their raw data). So, while some libraries are excellent about having where, when, how, what samples were taken, some are totally barren and contain no information on the biological context. This is a challenge, as raw virus or sequence discovery is relatively simple in this day and age, but really being able to synthesize that information into something biologically relevant is the difficult part, which then requires somewhat complete metadata.
So what’s the story?
To start with a very convoluted analogy, I always view the Sequence Read Archive (SRA) as a big pile of papers on the ground, each covering 1 specific topic, in which bountiful knowledge exists. But there are a lot of papers and photocopies of papers, different colored papers, some are bound into books or pamphlets, different shapes and sizes, crumpled… and I digress.
The nice thing is that with Logan we essentially now have a way to (relatively) easily see what is written on those papers - interested in entomology? Here are 10,000 pages that probably contain some information about entomology! This is obviously a huge advantage on just having a pile of unusable tree products, but just having a bunch of disjointed facts about bugs, some new and some known, is still not ultimately useful in actually understanding them.
In a nutshell, this problem can really be thought of as below: given our million of pages of information, how can we a) retrieve the pages that we are interested in (Logan somewhat solves this but that’s a separate discussion) b) use this information to make an interesting discovery (scientific, biological, technical, etc). To continue the analogy longer than it probably deserves, how do we avoid reading 10,000 individual pages about 5000 different bugs, and trying to guess where bugs like to live in general blindly?
There are a few ways I can think of to do this (in the analogy). Let’s say for every bug-related piece of paper we read, we put that paper into a bucket that says: this bug lives in [BUG HABITAT] based on the information in the text and sort them that way. This gives us a way to stratify the data and make a prediction about where bugs are most likely to be. We can also look at how many pieces of paper talk about bugs, and compare it to fish, which can tell us what people like to write about. Let say for each piece of paper that talks about a bug, we record the weight of the bug (if reported), and collate that into the average bug weight. This can definitely tell us something about bugs!
To translate this into SRA-metadata terms, the paper is the SRA run itself, while all the other information (location, sequencing type, etc) is some kind of classification of the nature of the paper the information is on, or what it contains.
Seems simple and logical right? Just sort all your SRA runs into bins, and draw some conclusions! Well, don’t we all wish it were that simple.
There are some issues that separate this ideal, buggy pile of paper from the SRA. First of all, not all metadata is created equal. Because of the freedom that submitters have in filling out metadata when uploading their raw reads to the SRA, things get very… unpredictable. As mentioned, fields are not always consistently filled out, and when filled out, not in a consistent way. A really good example of this the geographical metadata. One SRA run might have the exact coordinates of the data collection included, but another might only have a string like “Vancouver”. How do we normalize that meaningfully? Thankfully, a software engineer worked really hard, and came up with a solution (described here), that uses geocoding providers (think AWS level giant data sources) to essentially make a best guess at what the actual coordinates are by reading the metadata field and making a prediction. Think of this as reading every single bug paper and writing down where you think this bug is (but the computer does it for you).
You can see this for yourself here! Visualized as “sampling effort” of every 50km x 50km grid of the earth, based on the number of BioSamples attributed to that square:
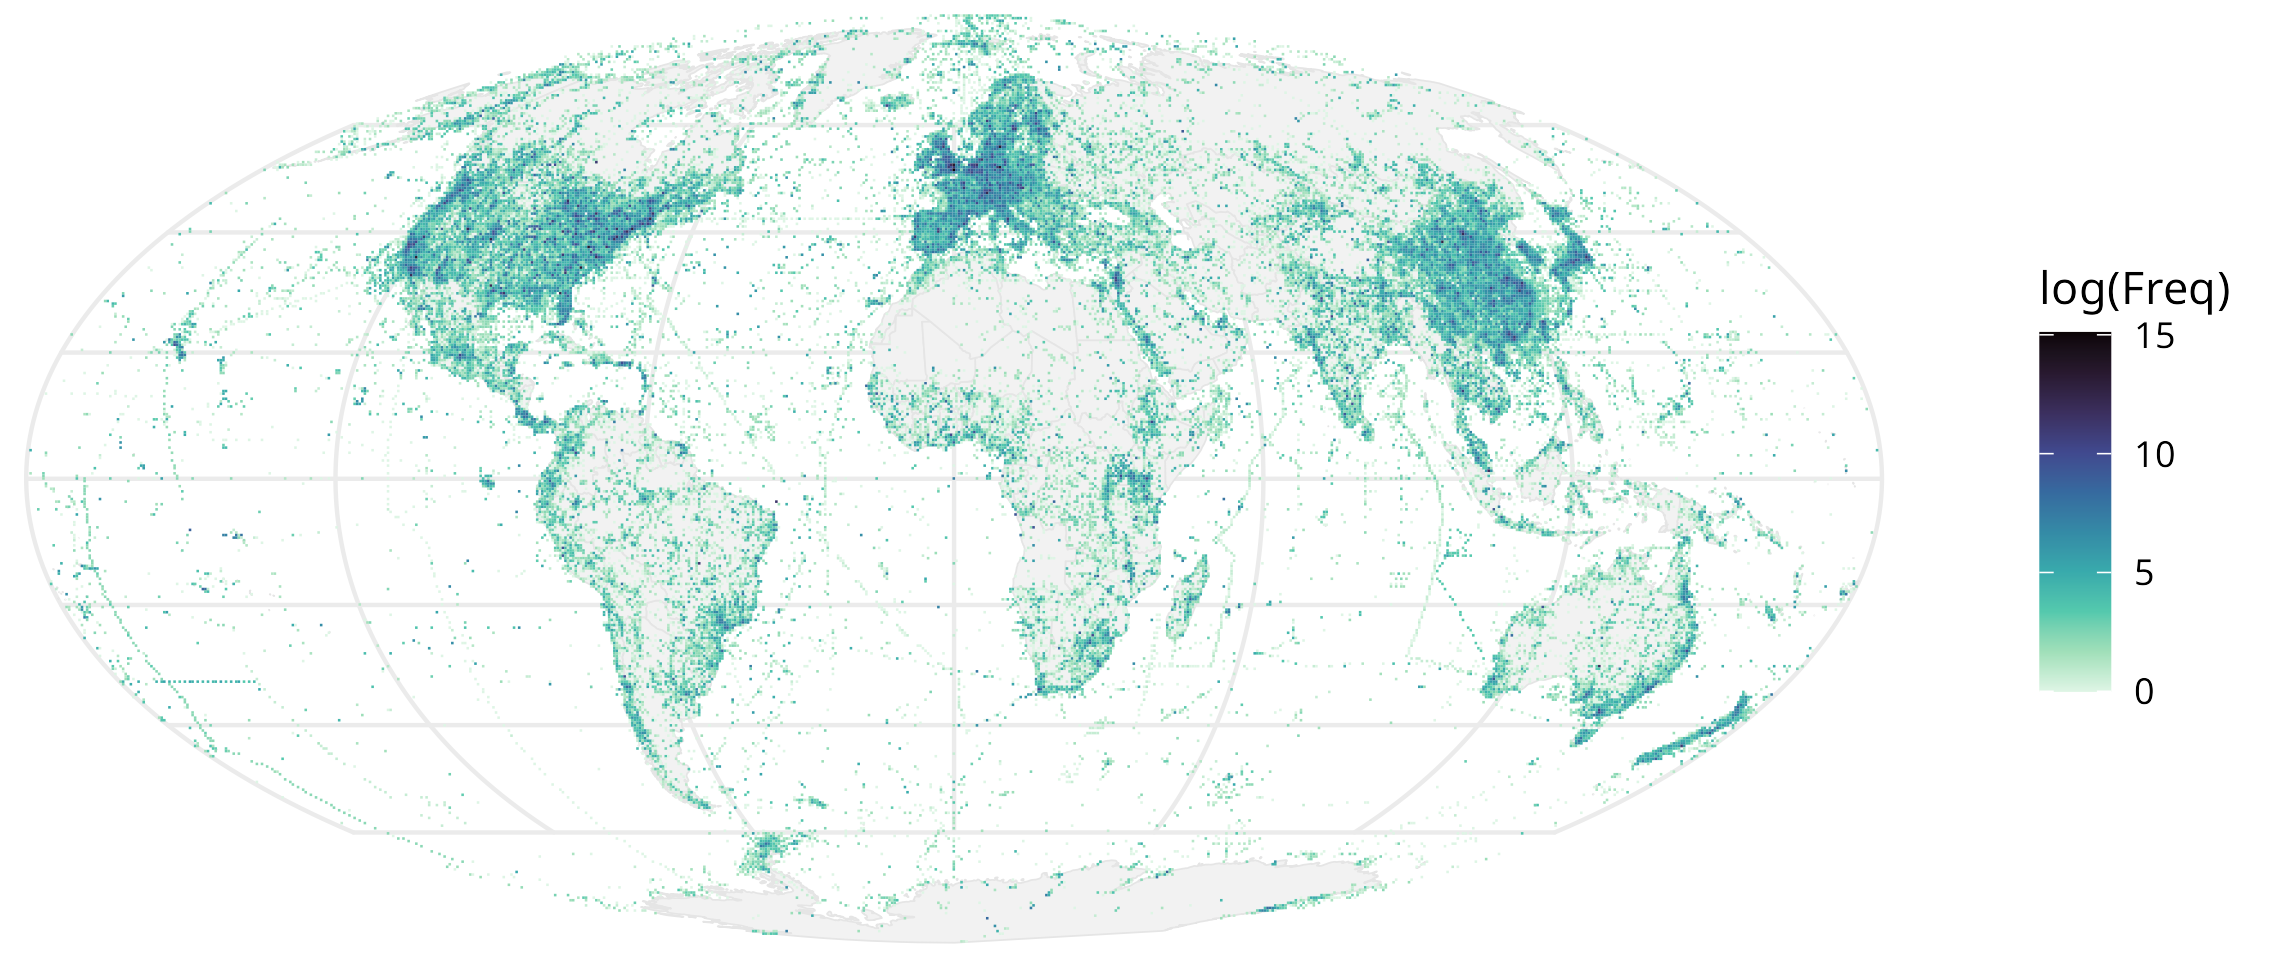
Just this image is pretty cool! For instance, a postdoc in my lab pointed out you can trace some of the major shipping channels, and another collaborator, the gaps where the physical location is inaccessible (like the Himalayas).
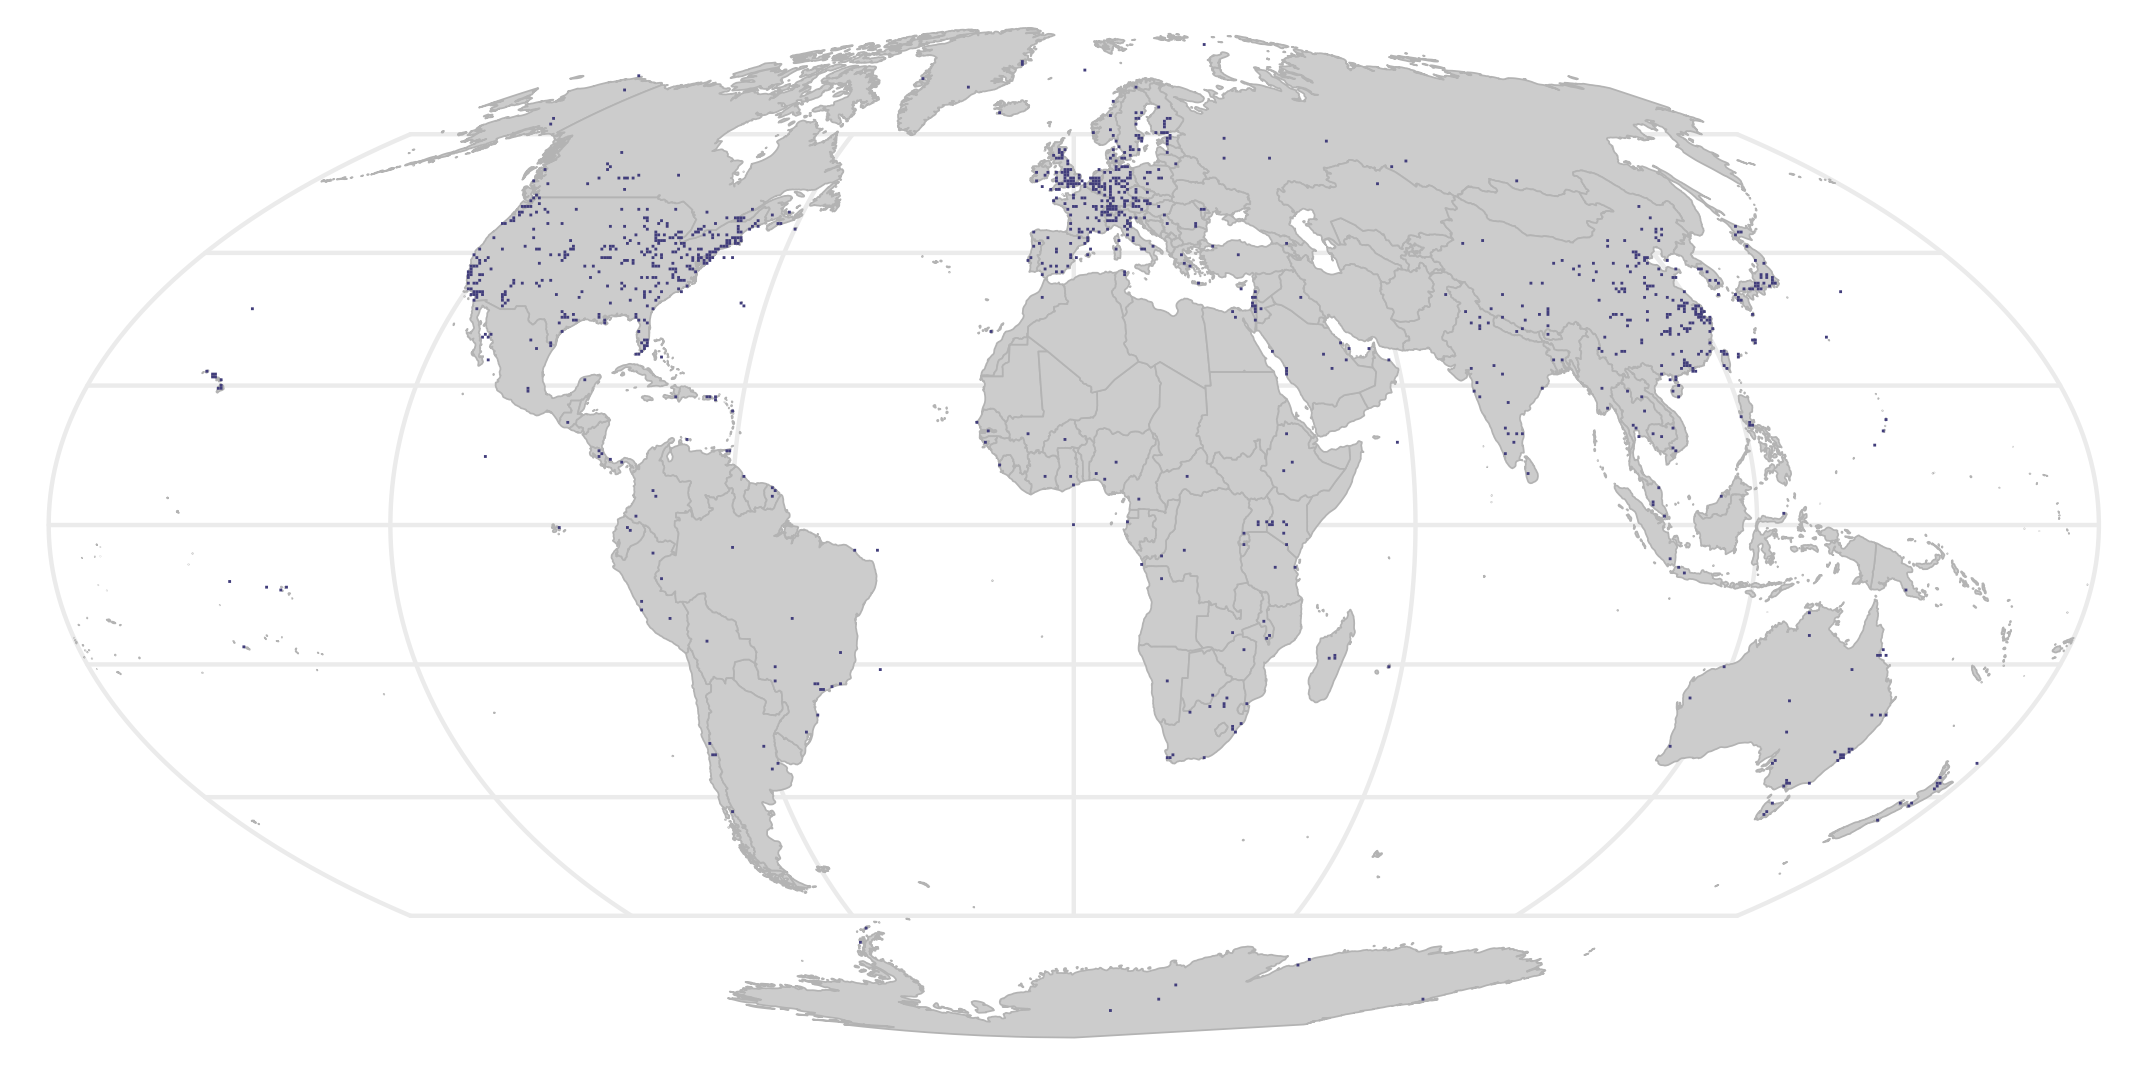
You can also track more granular data, like someone’s experiment through the oceans (anecdotal from my supervisor)! This figure also confirms some of the assumptions that we already had - for instance, countries with a lot of money and scientific infrastructure will sequence way more. You can formalize this into a hypothesis and test it: for every grid, is it statistically different from the average of a lot of grids? A p-value can be assigned, and you get this nice map of places that are statistically significantly “over-sampled”:
Another fun thing that can be done is assign each 50km x 50km grid to a World Wildlife Foundation determined ‘biome using the boundaries:
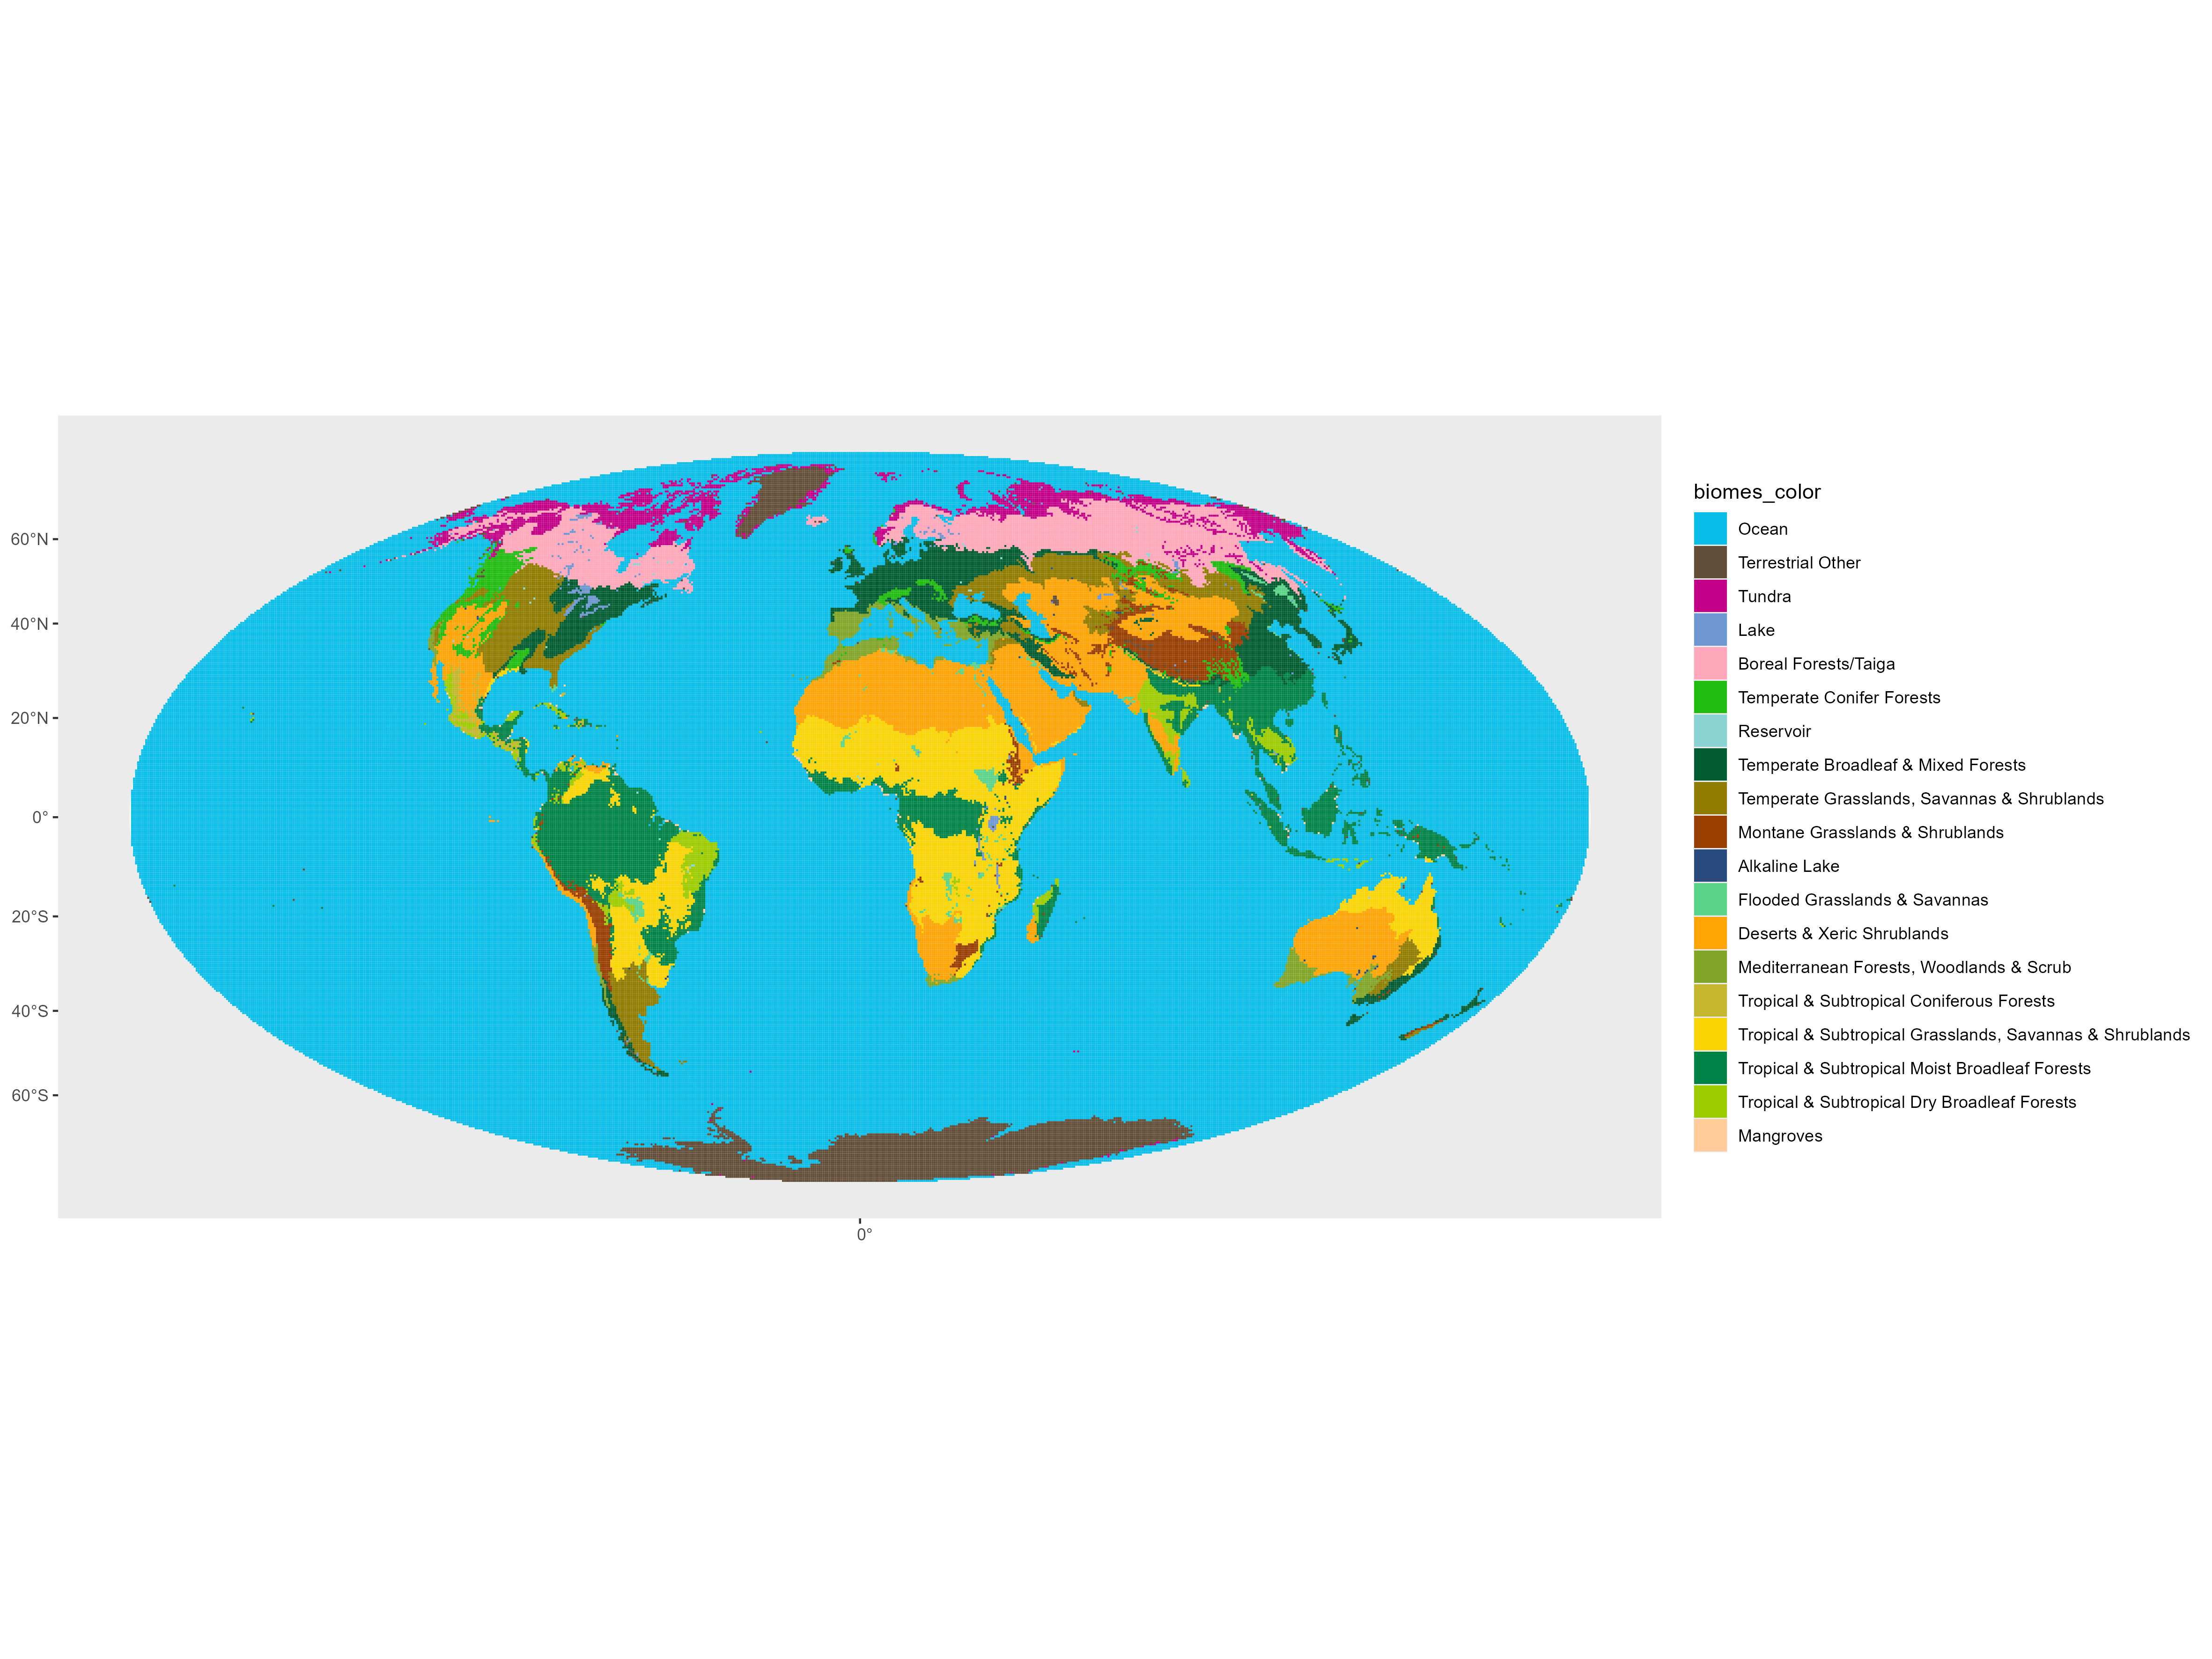
Then we can show what kind of ecological niches people like to sample (and which we are missing!):
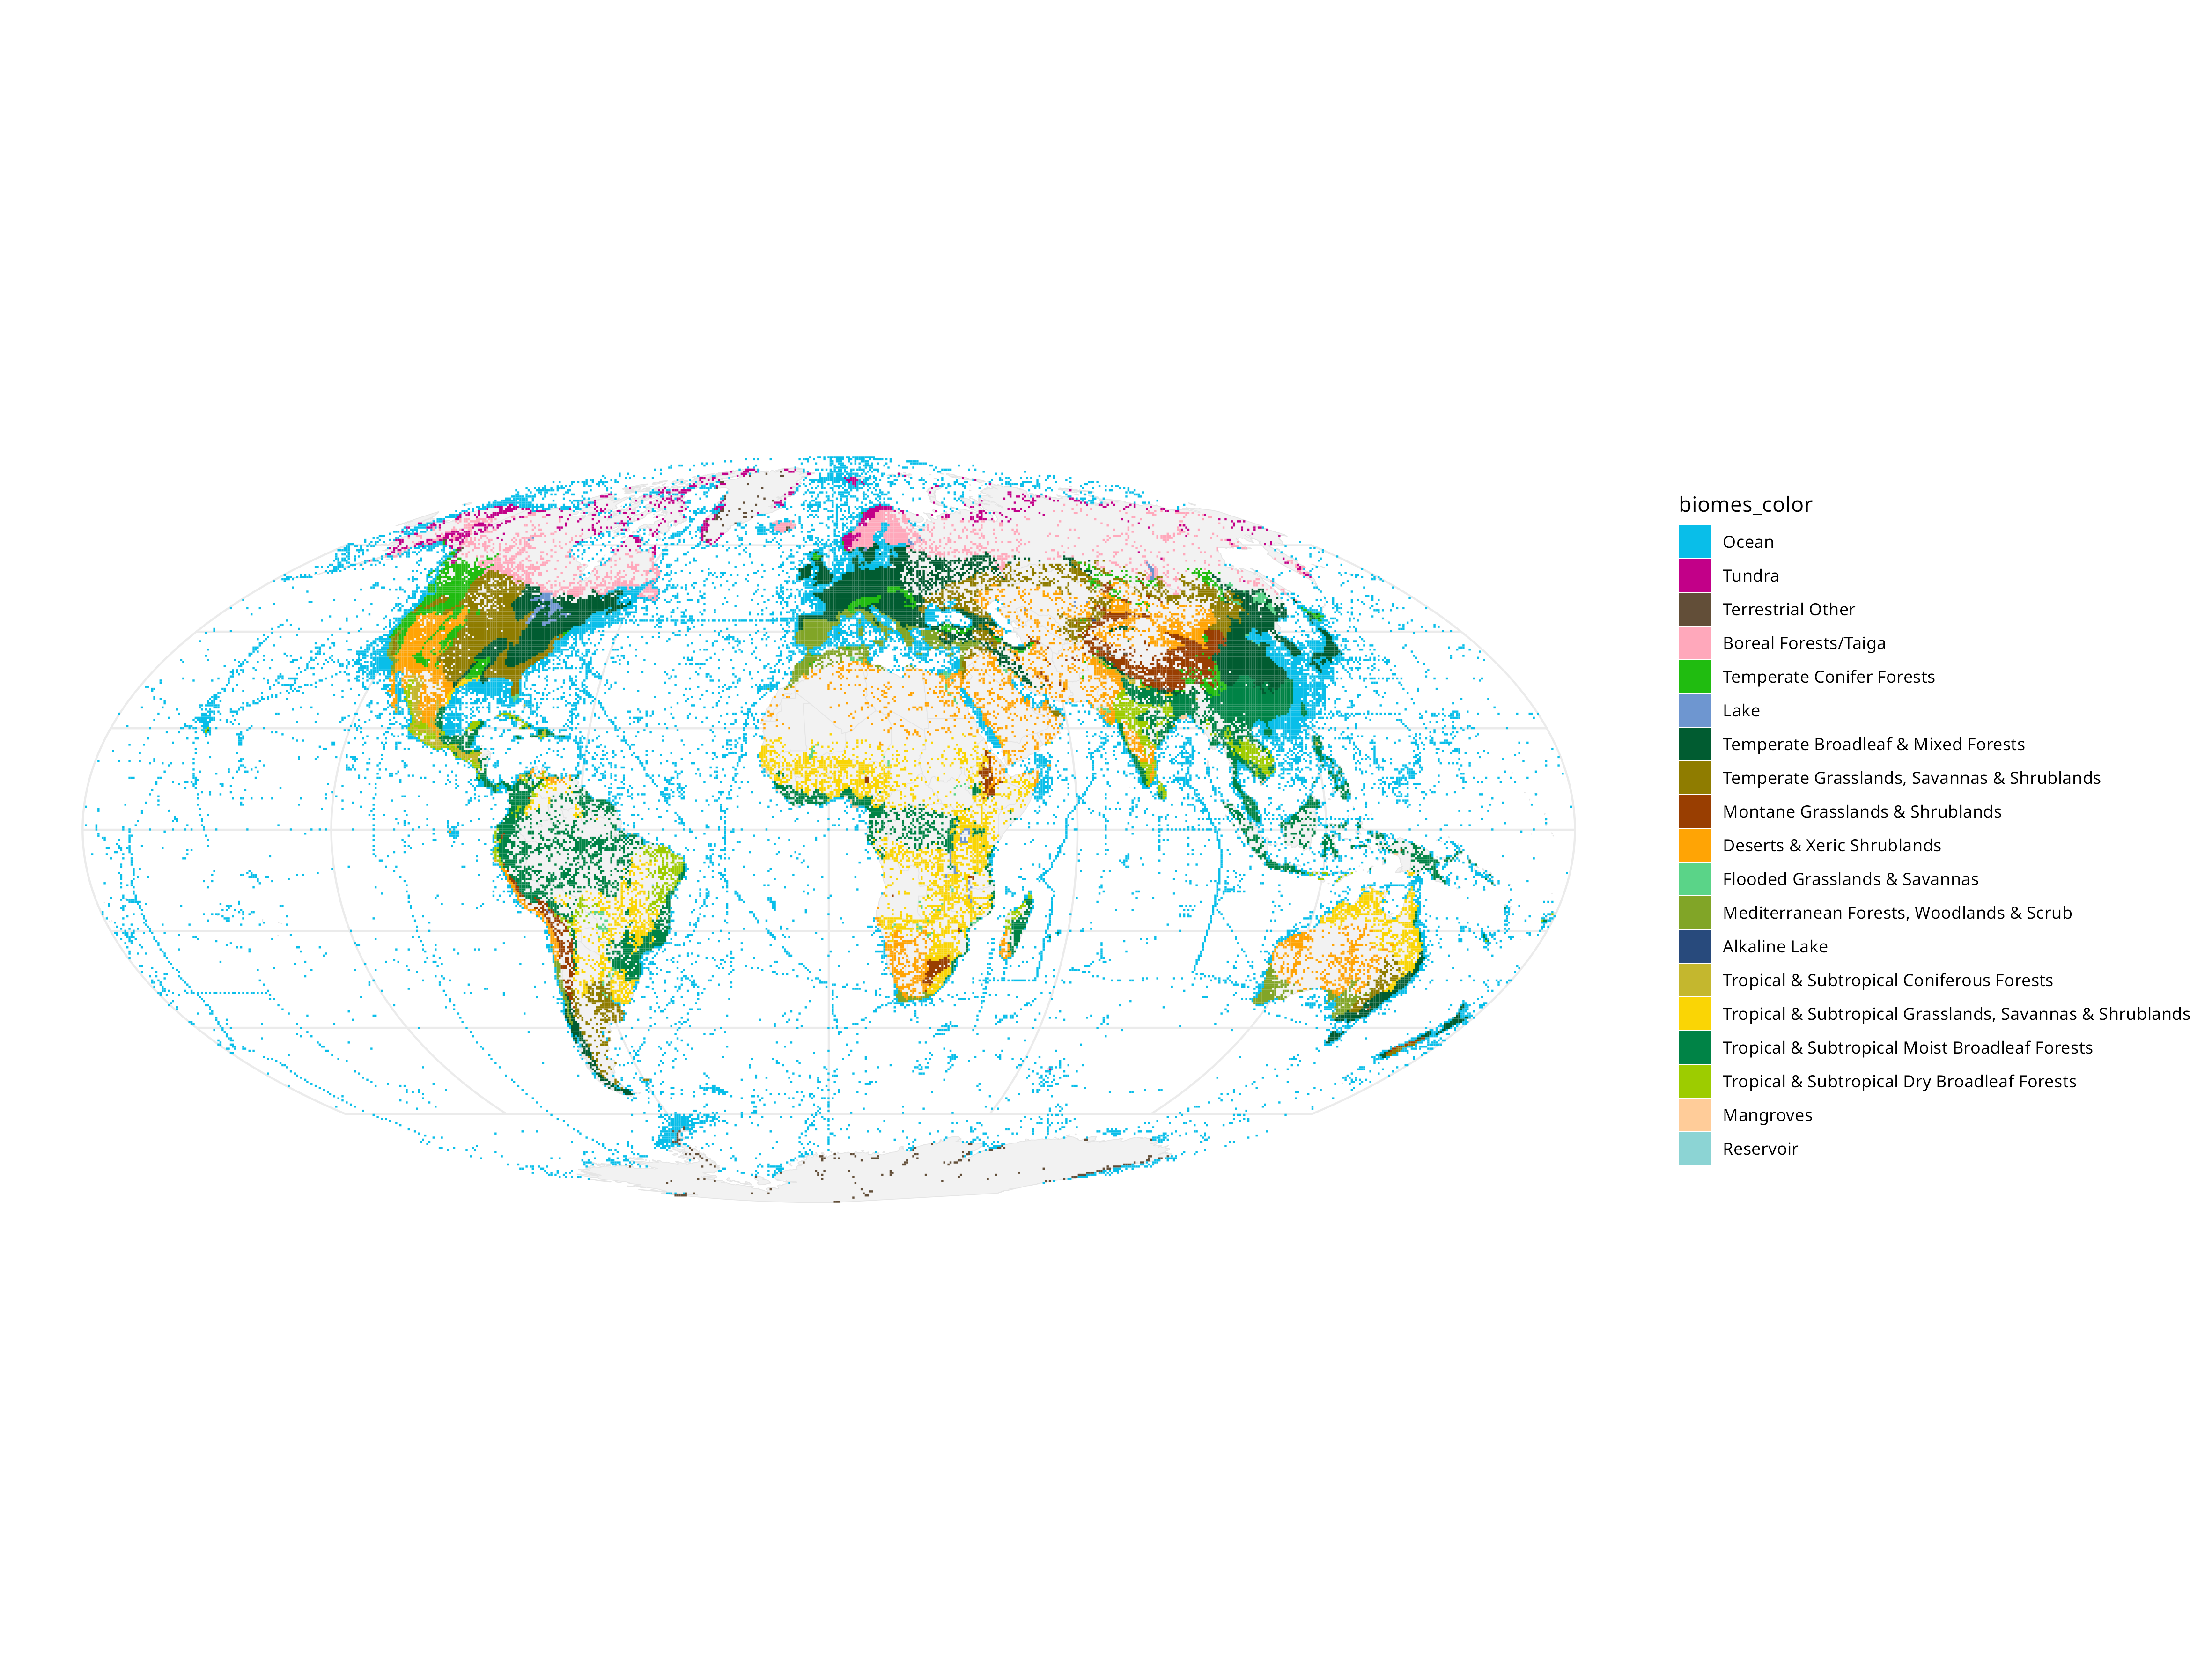
Represented in a different way:
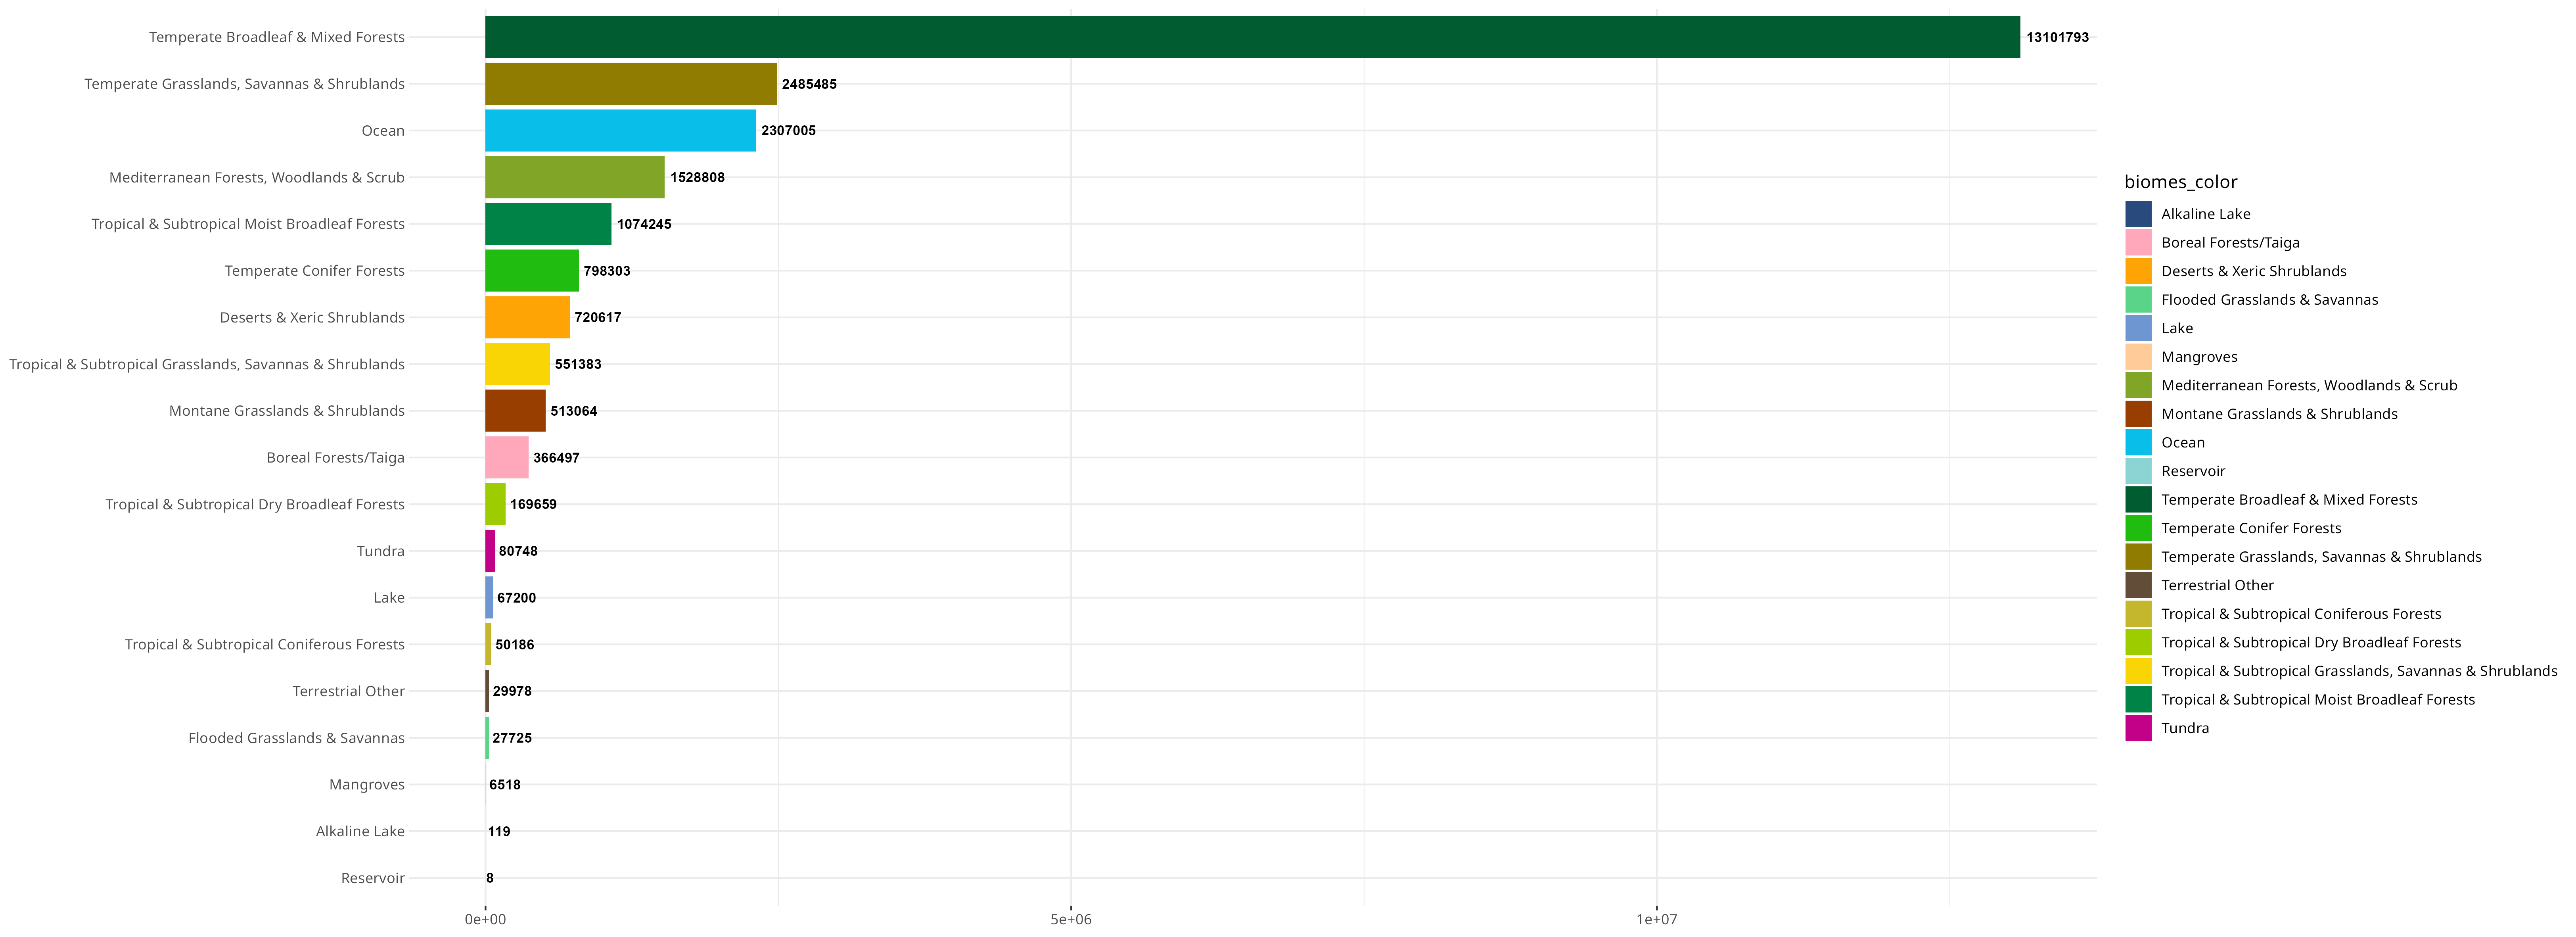
So it’s pretty obvious that because people sample where there is money and infrastructure to sample, we disproportionately have data on “boreal forests” (see The WEIRDest People in the World).
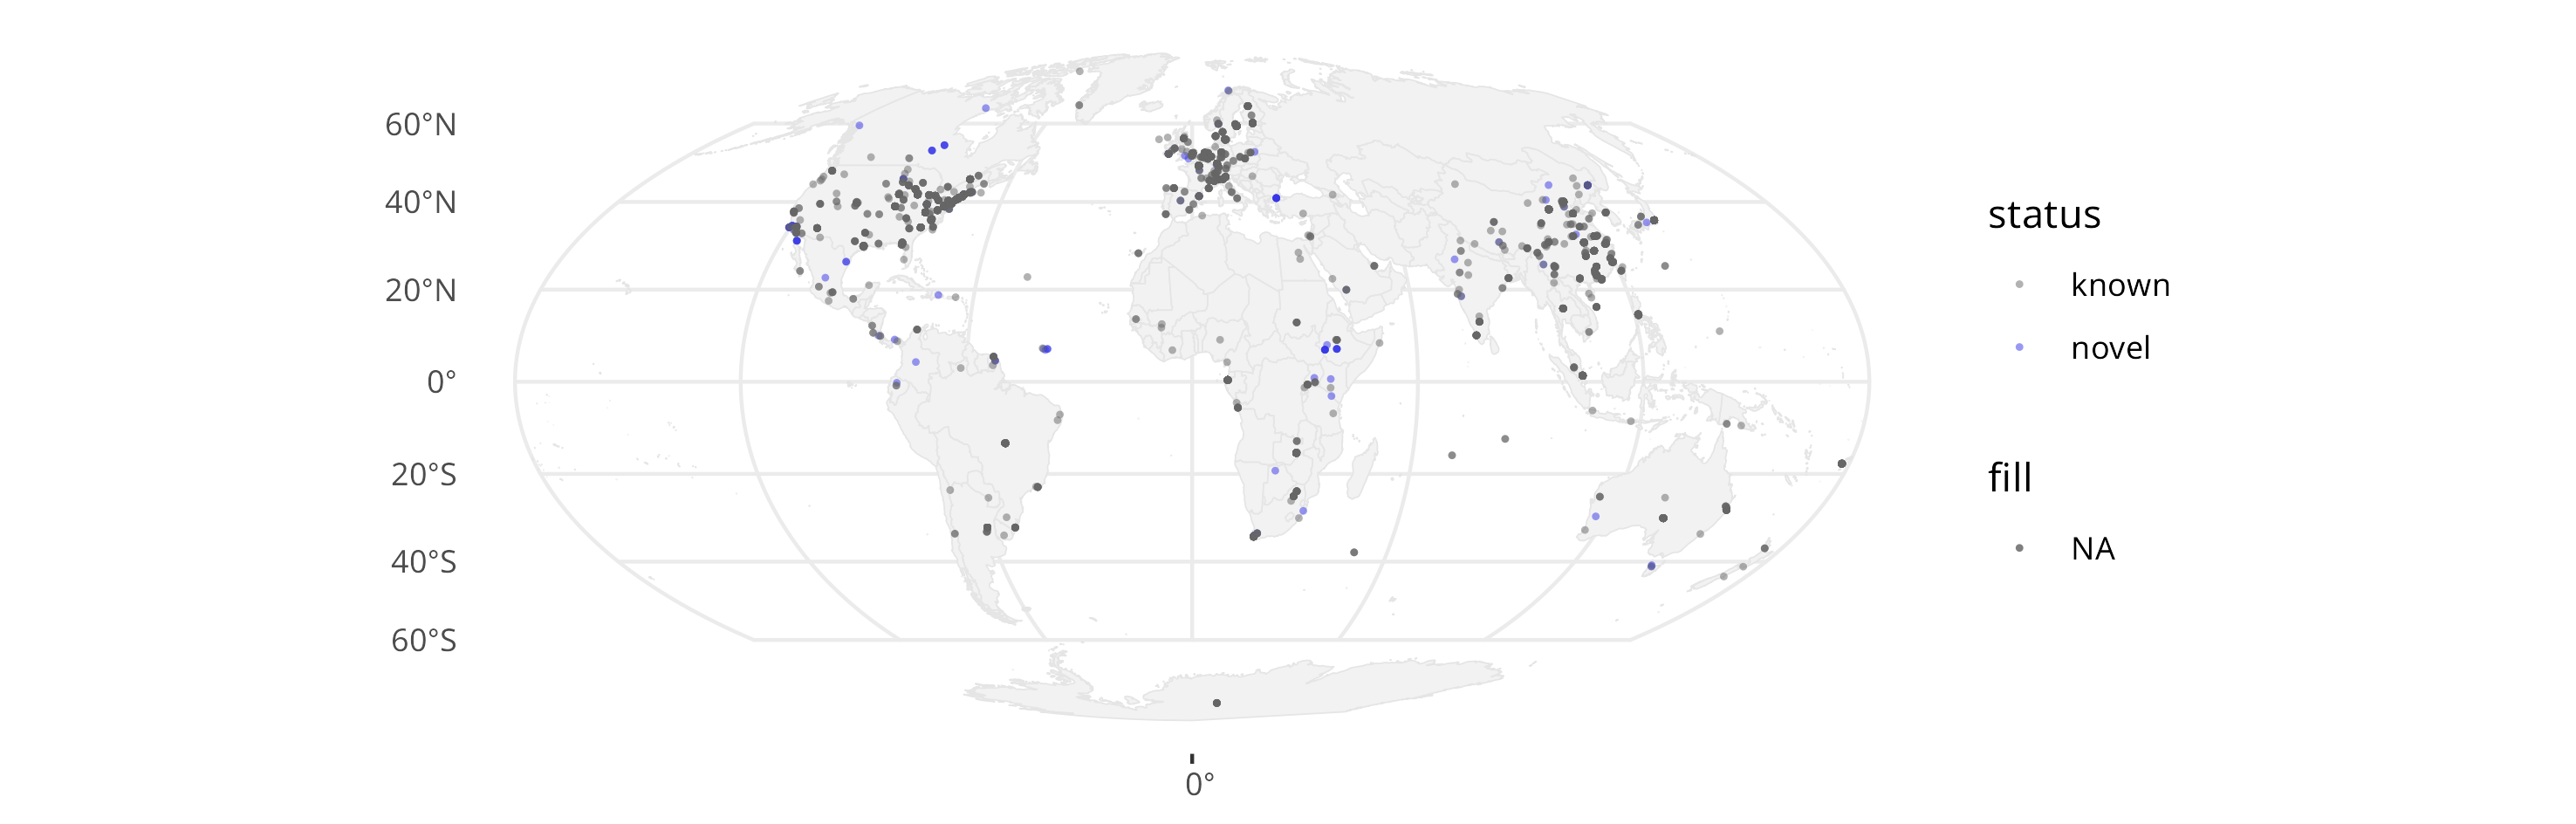
Apart from kind of the first level observations you can make here, the hardest part is next - how do we make sense of all of this (and apply it to something useful)? Over the last few years, I’ve worked on finding all Papillomaviruses (PVs) in the SRA, and now have essentially a repository of where all PVs are in the SRA, and whether they are novel or of a known genotype. So you can think of the next analysis as an “inner join” of all the geographical data and my Papillomaviruses.
There are a lot of questions that can then be asked, but here are a few low-hanging fruit: a) Where are papillomavirus types found?
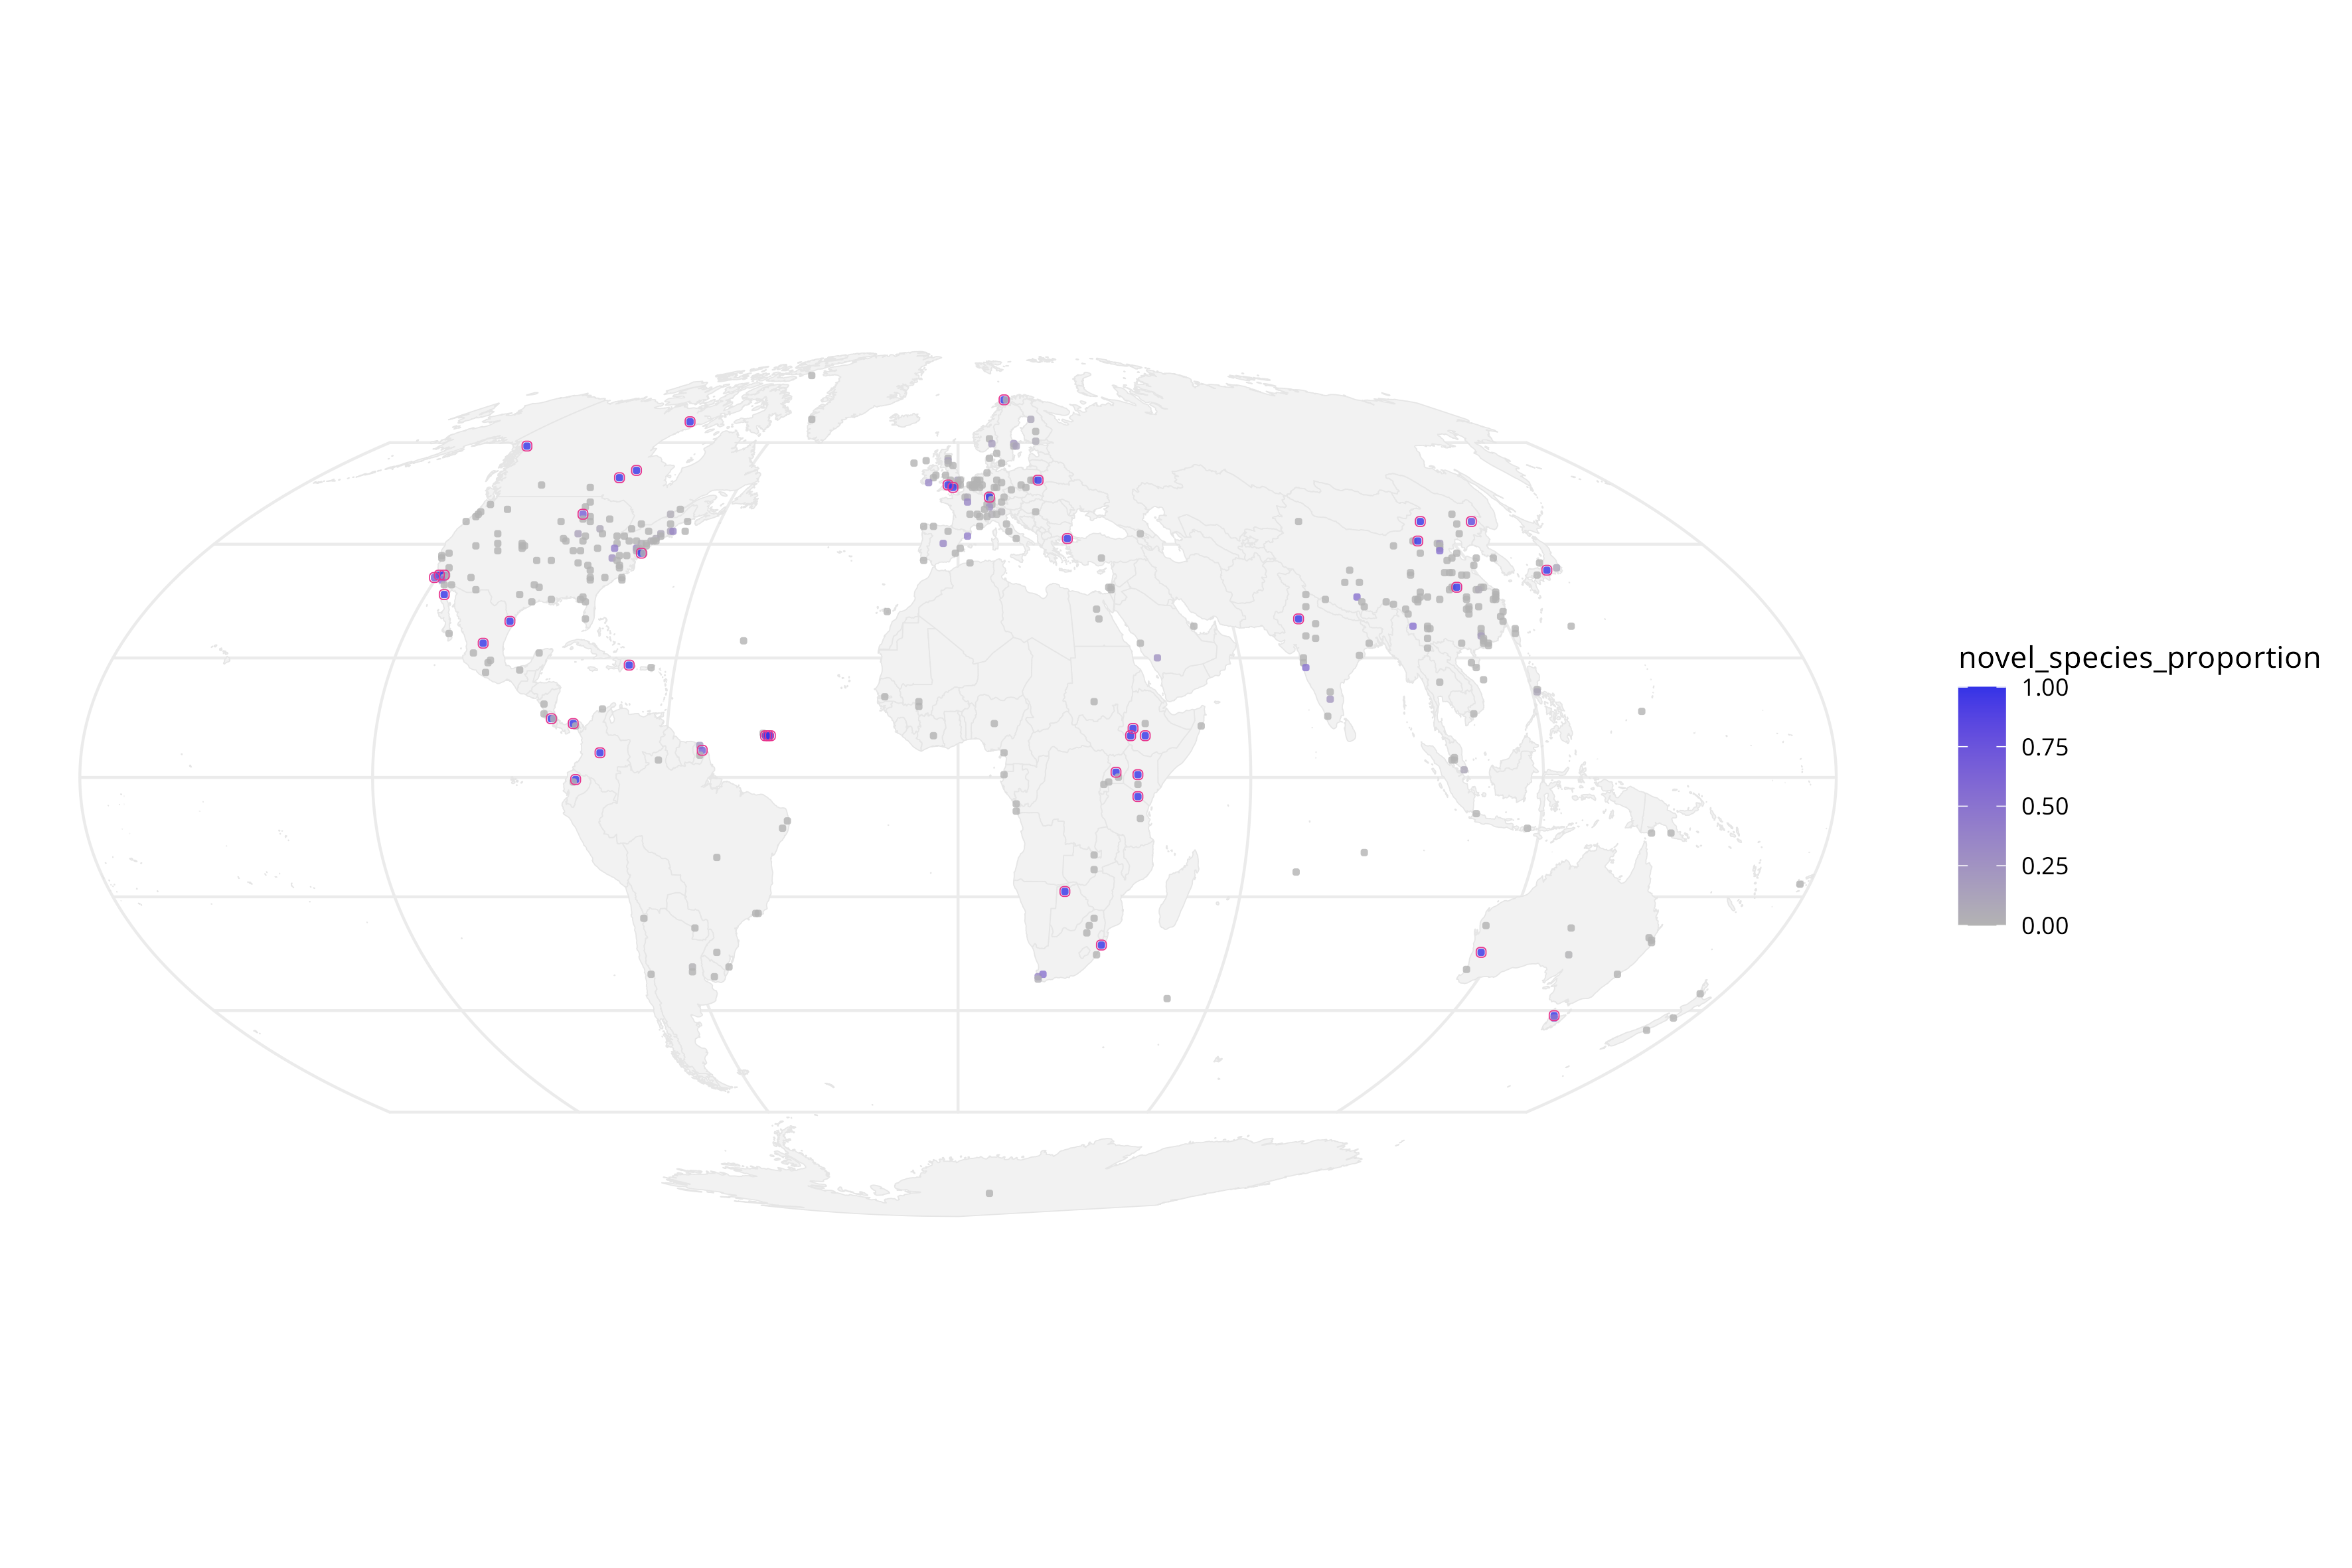
b) Are there regions where, statistically, more novel PV types are sequenced proportionally?
c) What about in biomes? Are certain areas enriched for PVs?
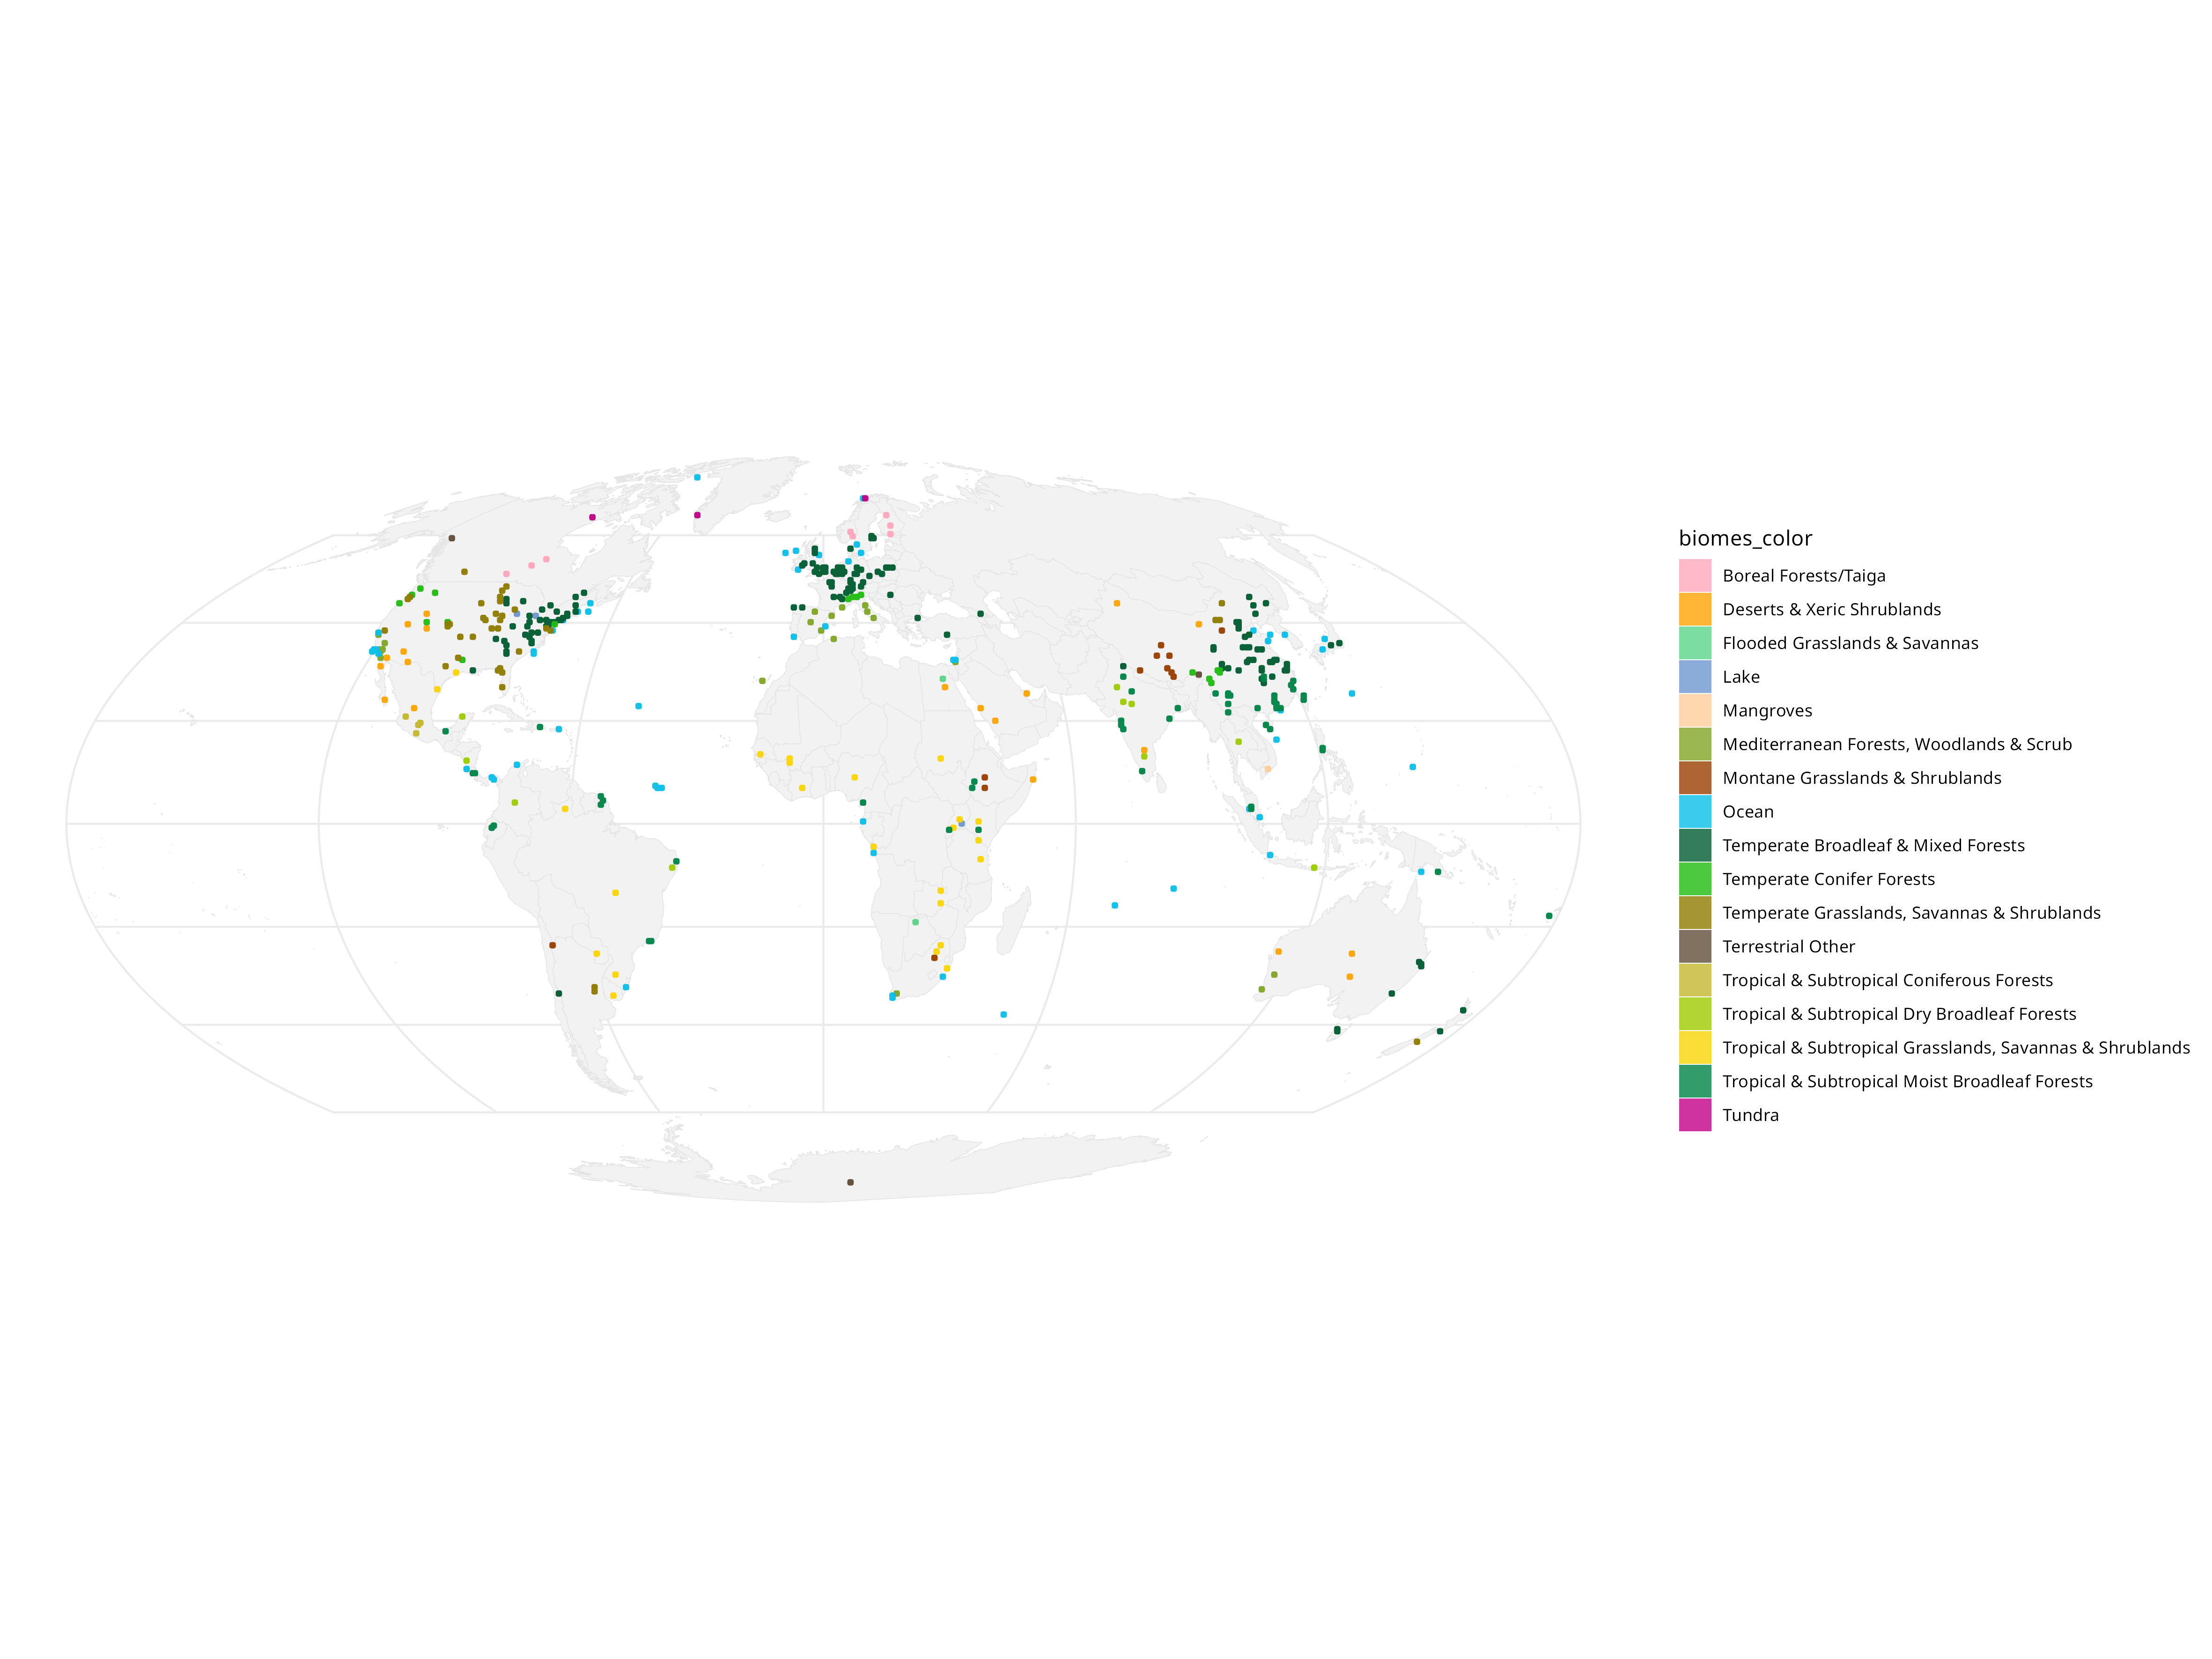
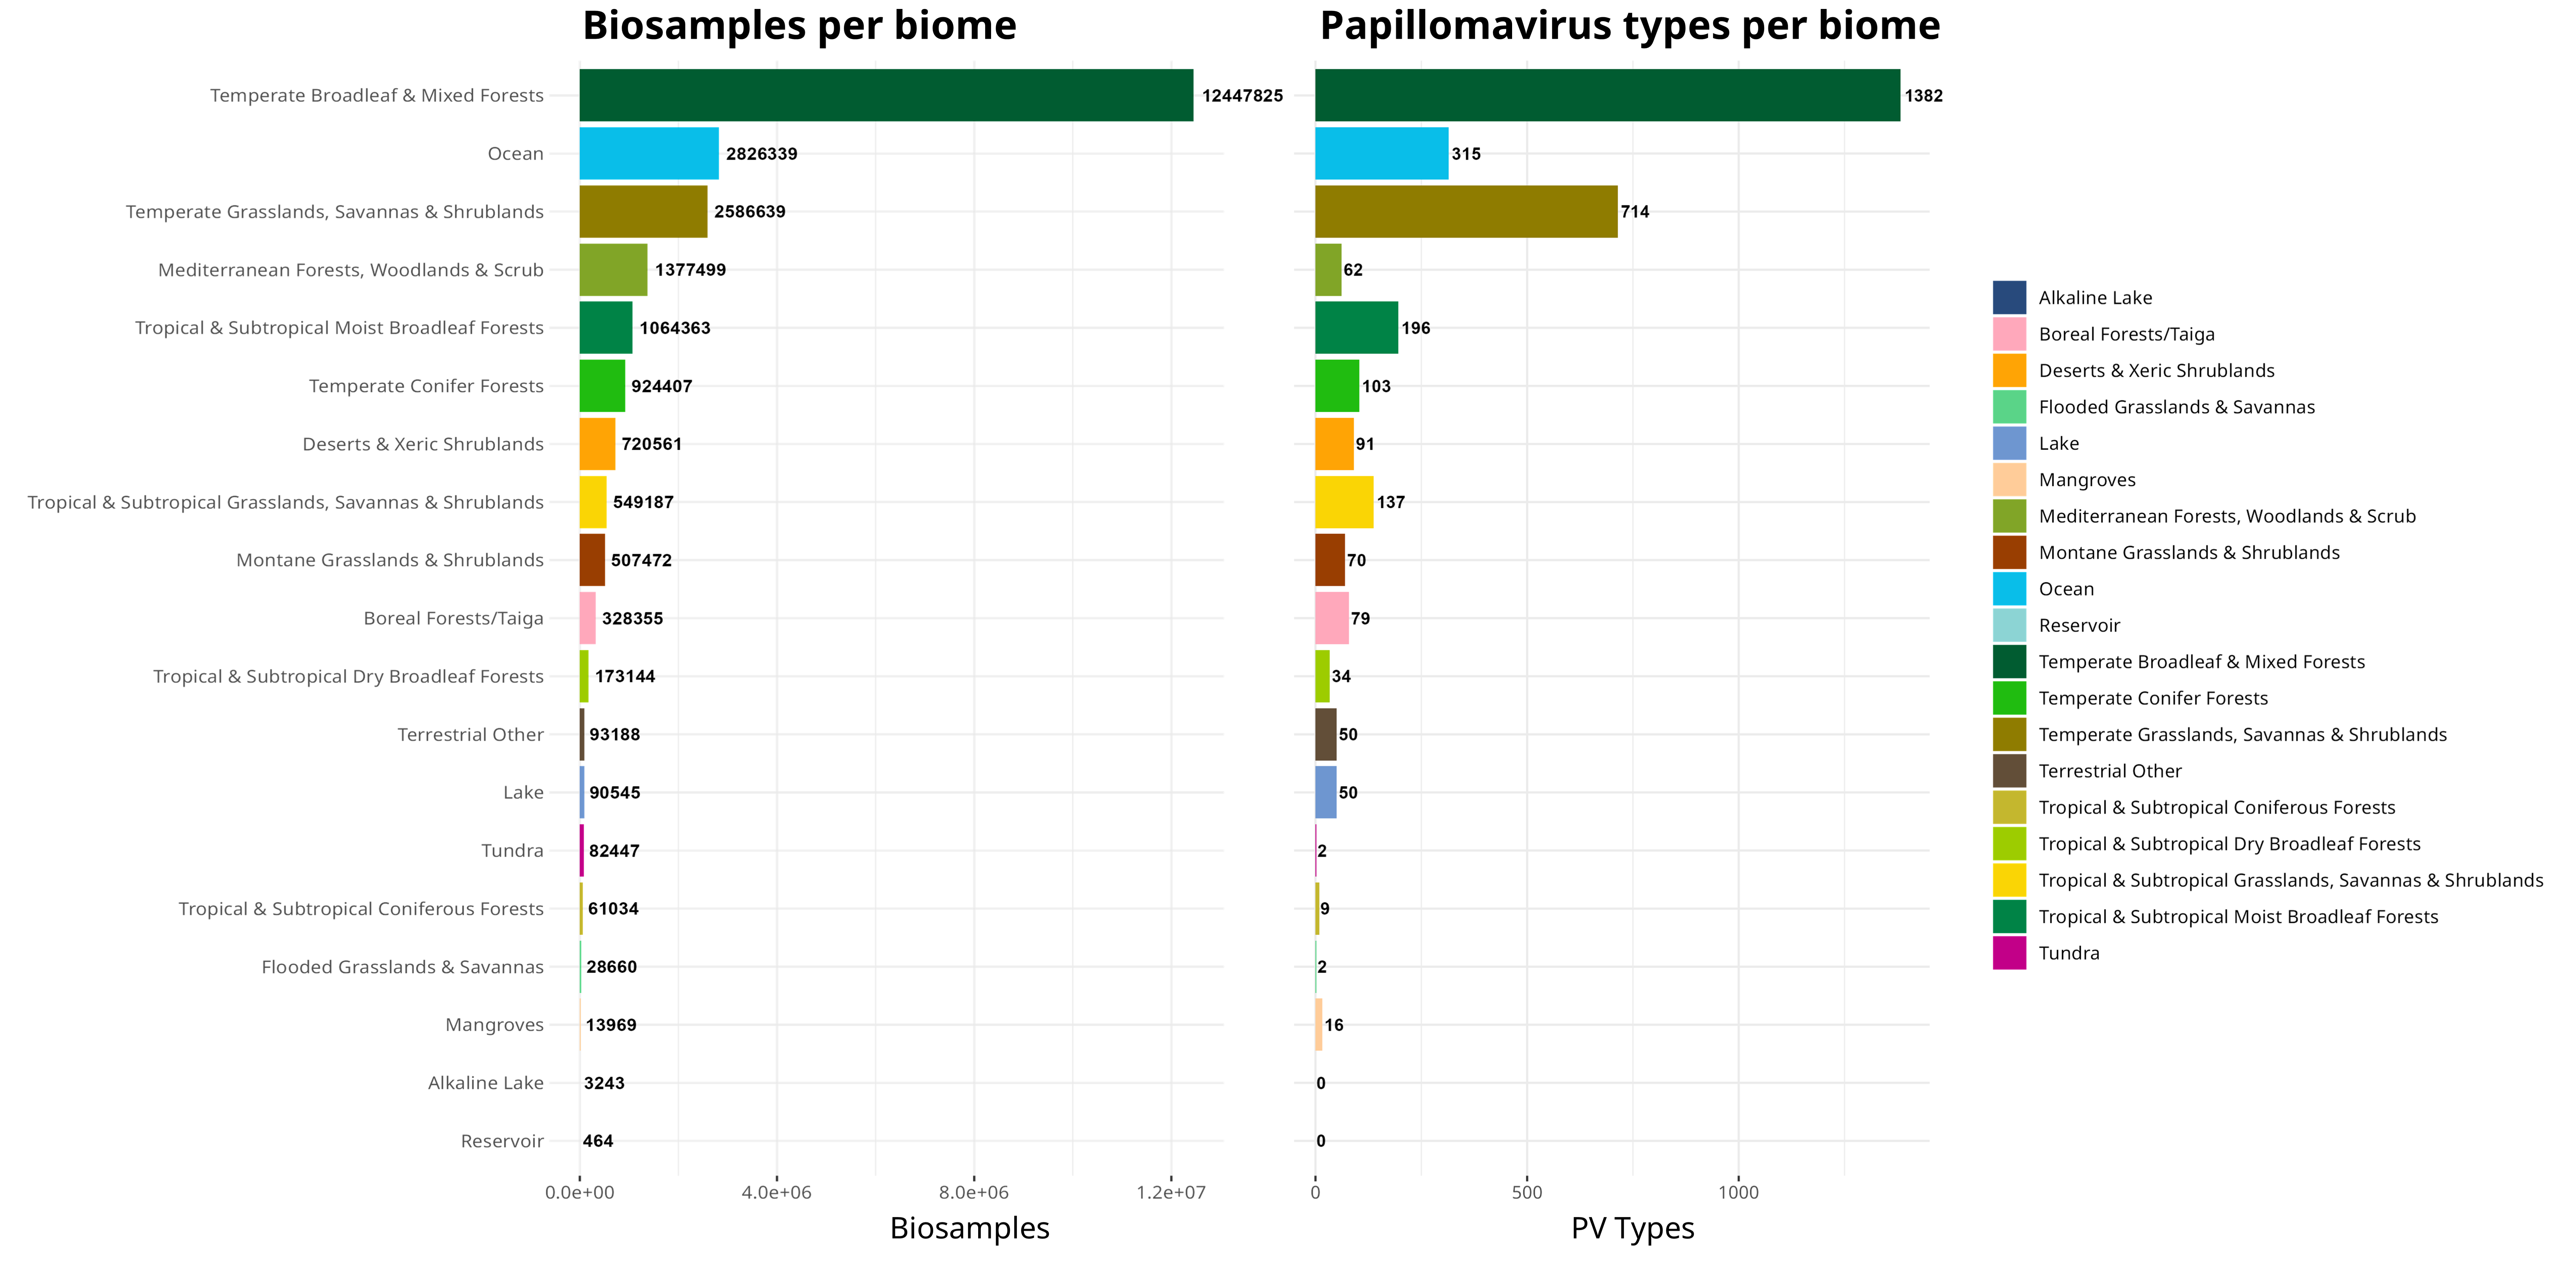
An interesting observation you can do with this data is see if the general trend of PV types follows the sampling density for each of these biomes:
d) Are there any unexpected patterns?
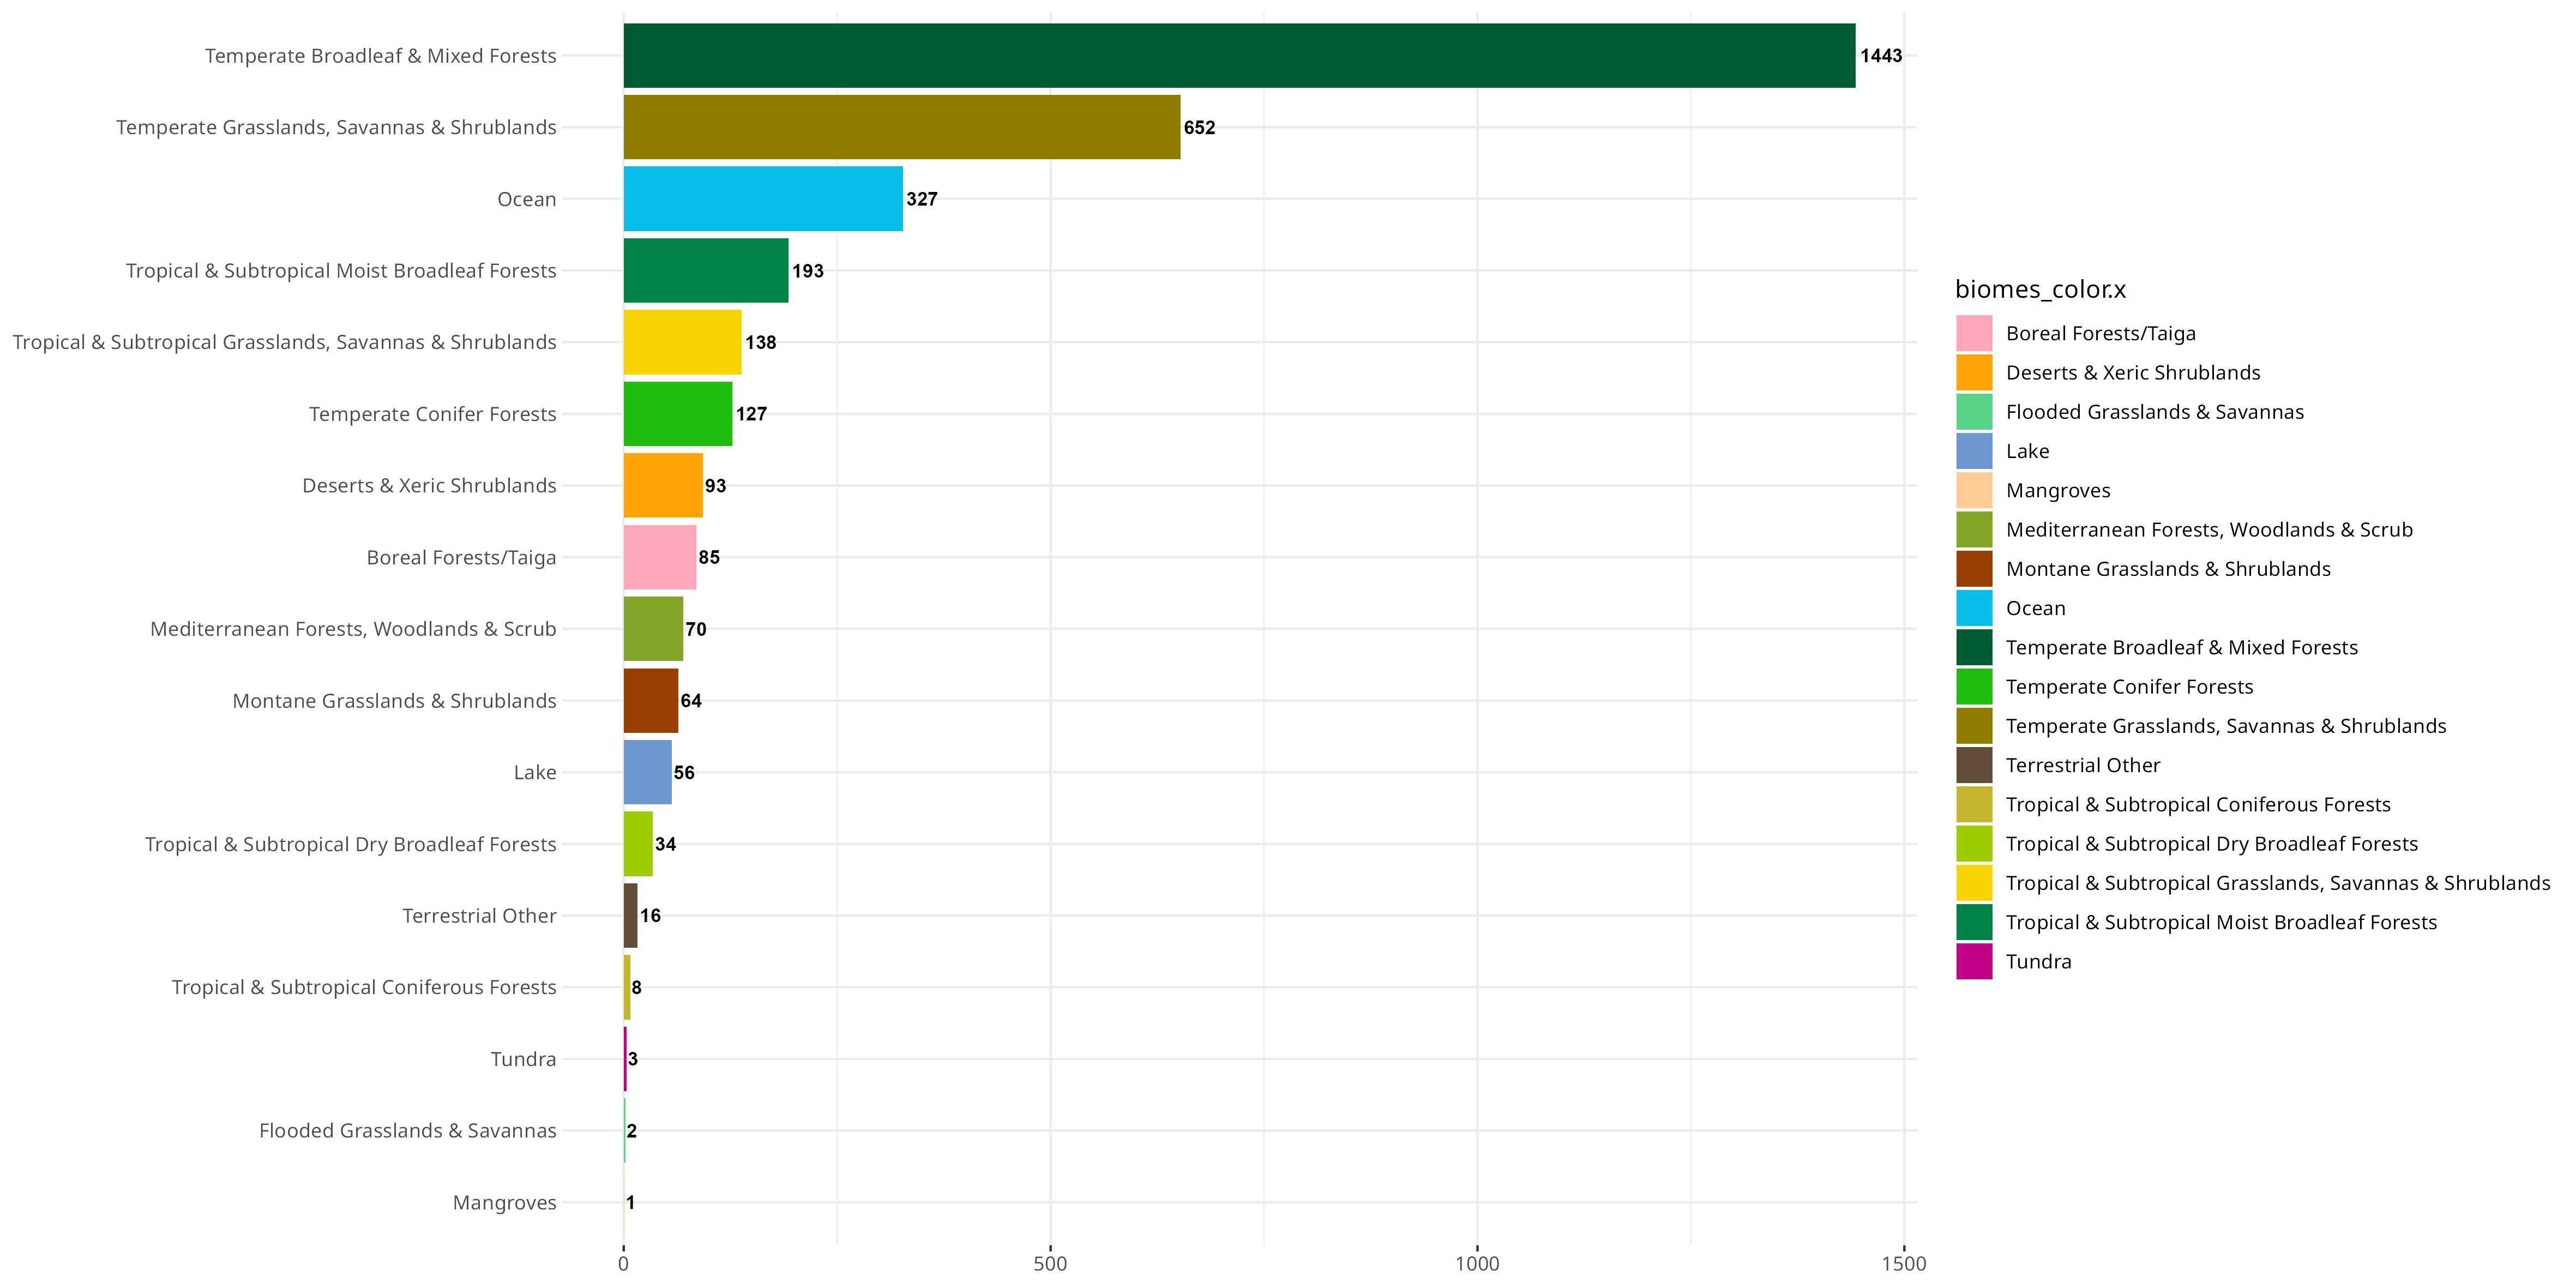
By simply ordering the PVs recorded in the order of sampling, we can see there are discrepancies based on how many PV types are recorded versus the number of BioSamples that have been found in a certain biome. This likely reflects differences in how accessible/biomass heavy these various biomes are - for example, I would not expect many people to go out of their way to sample all the tundra in the world!
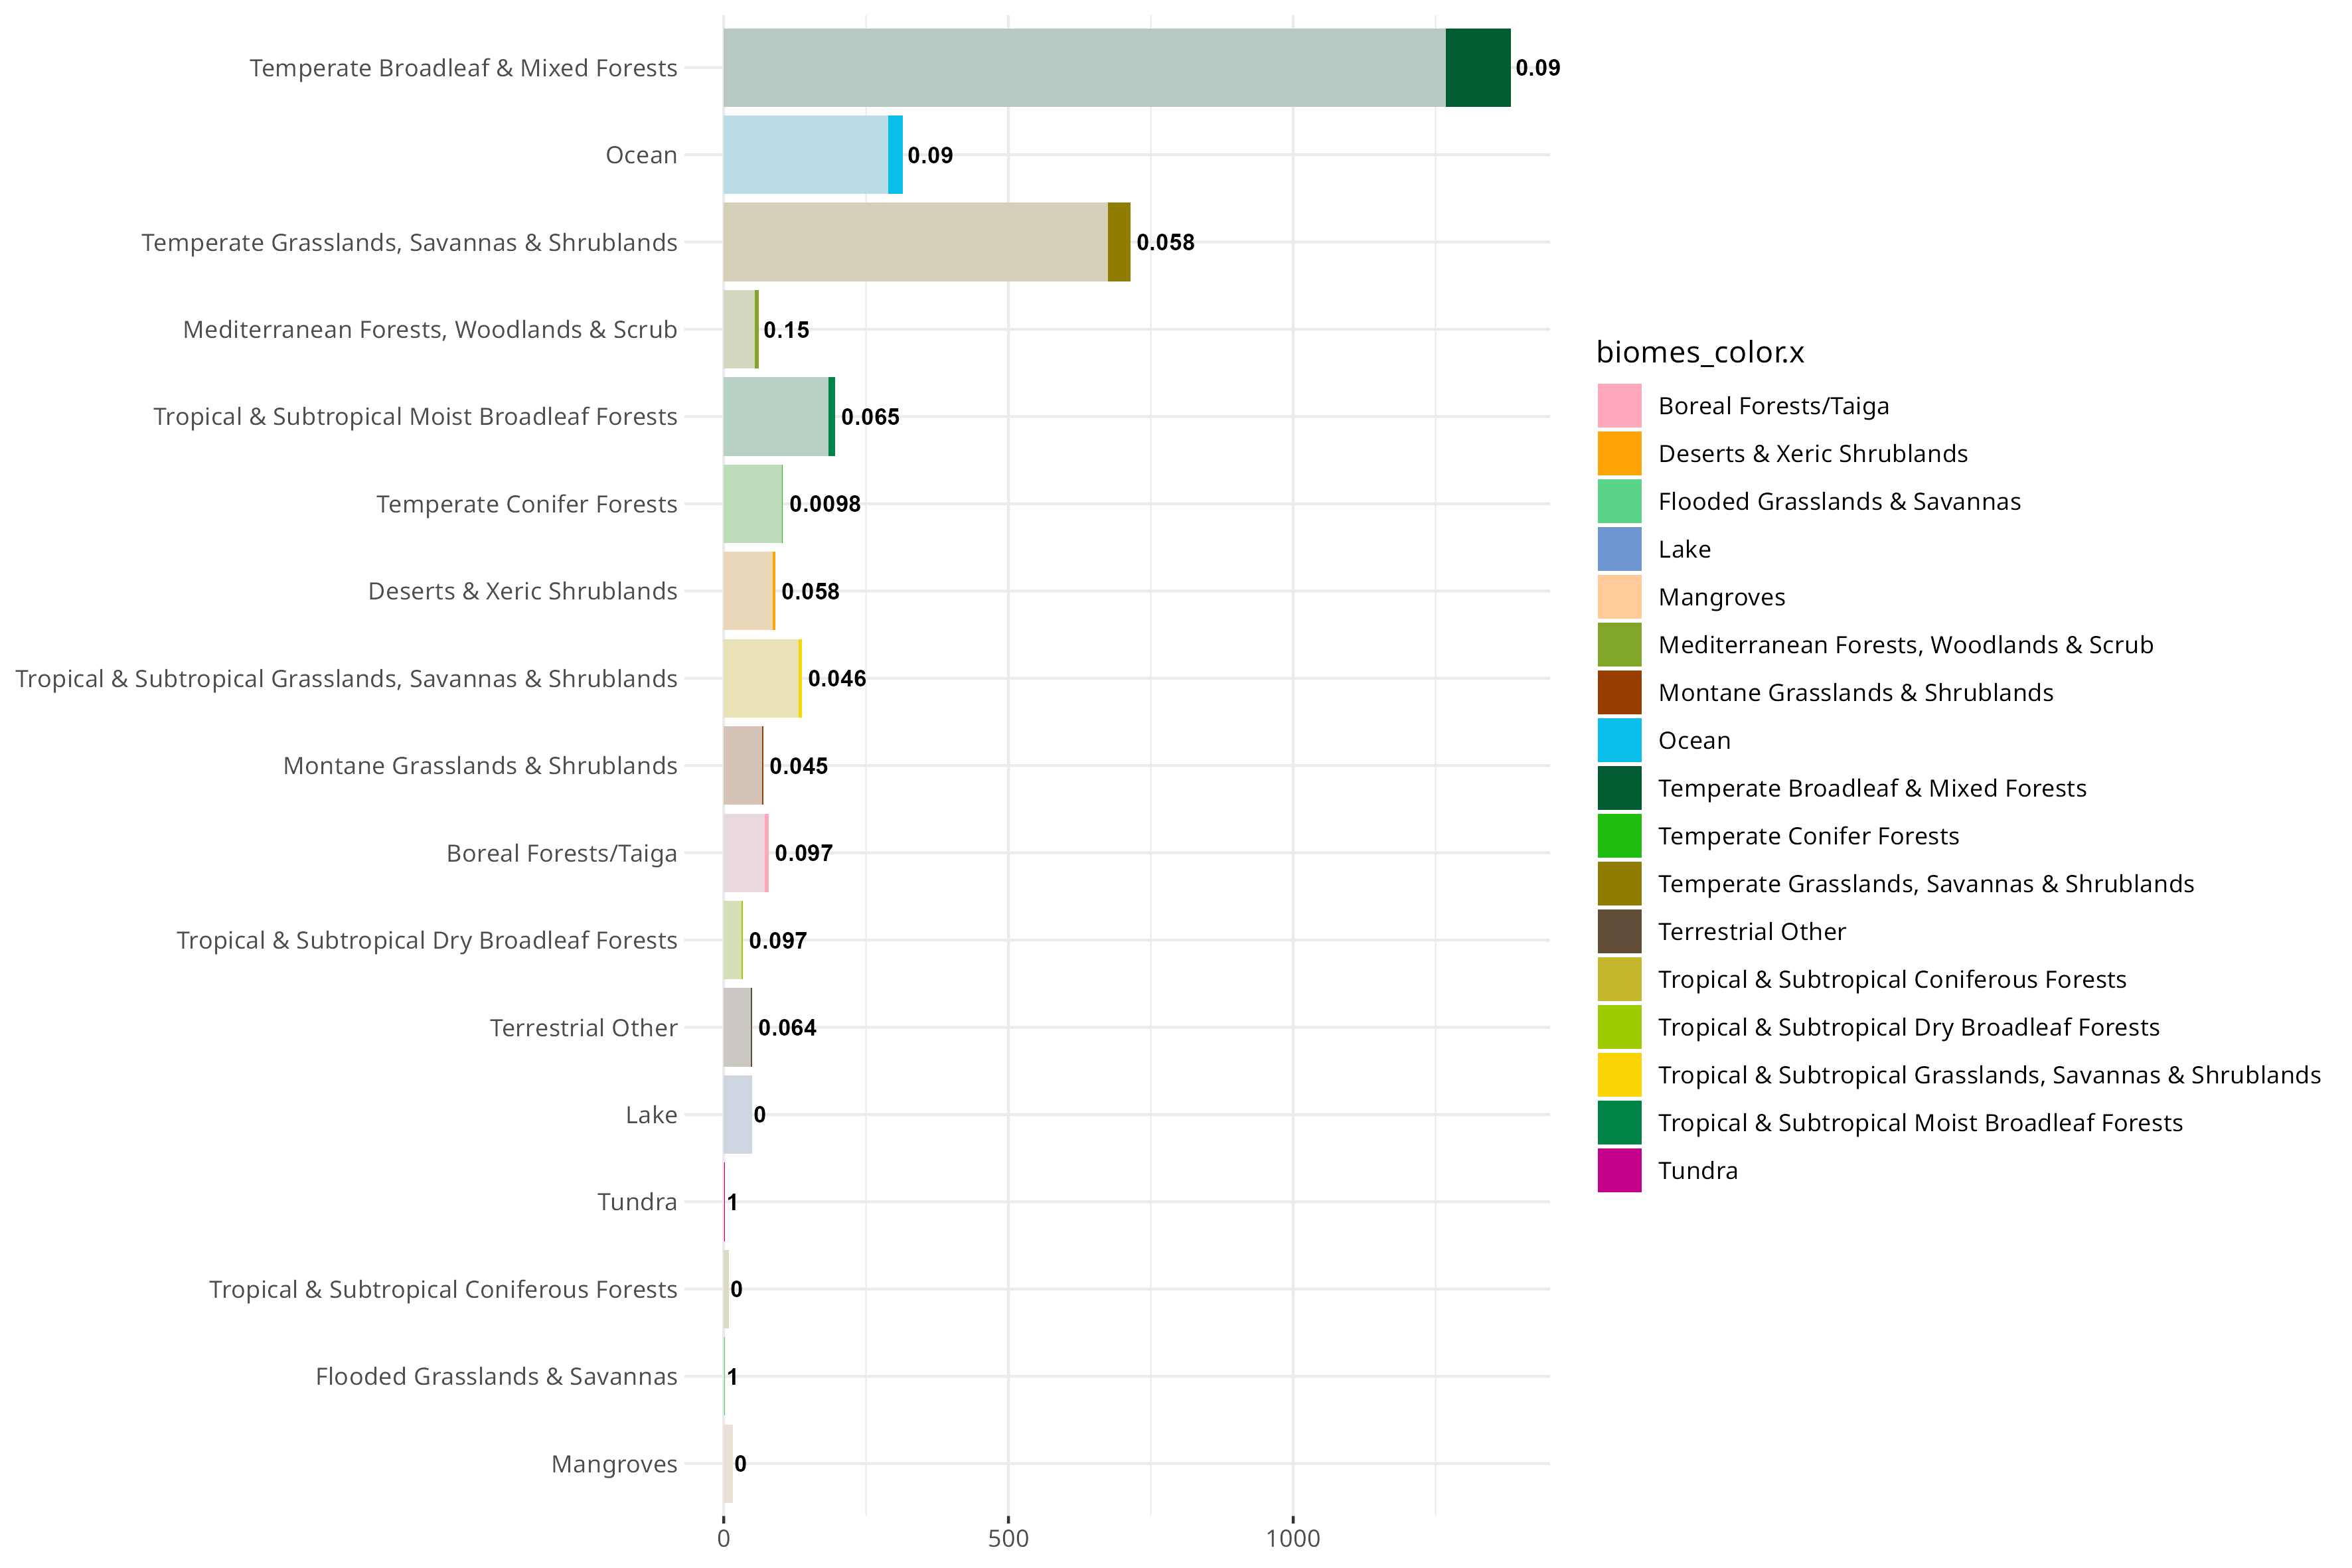
This is different from the proportion of novel types, though, probably as a combination of little sampling and people never really looking at certain places for the presence of PVs:
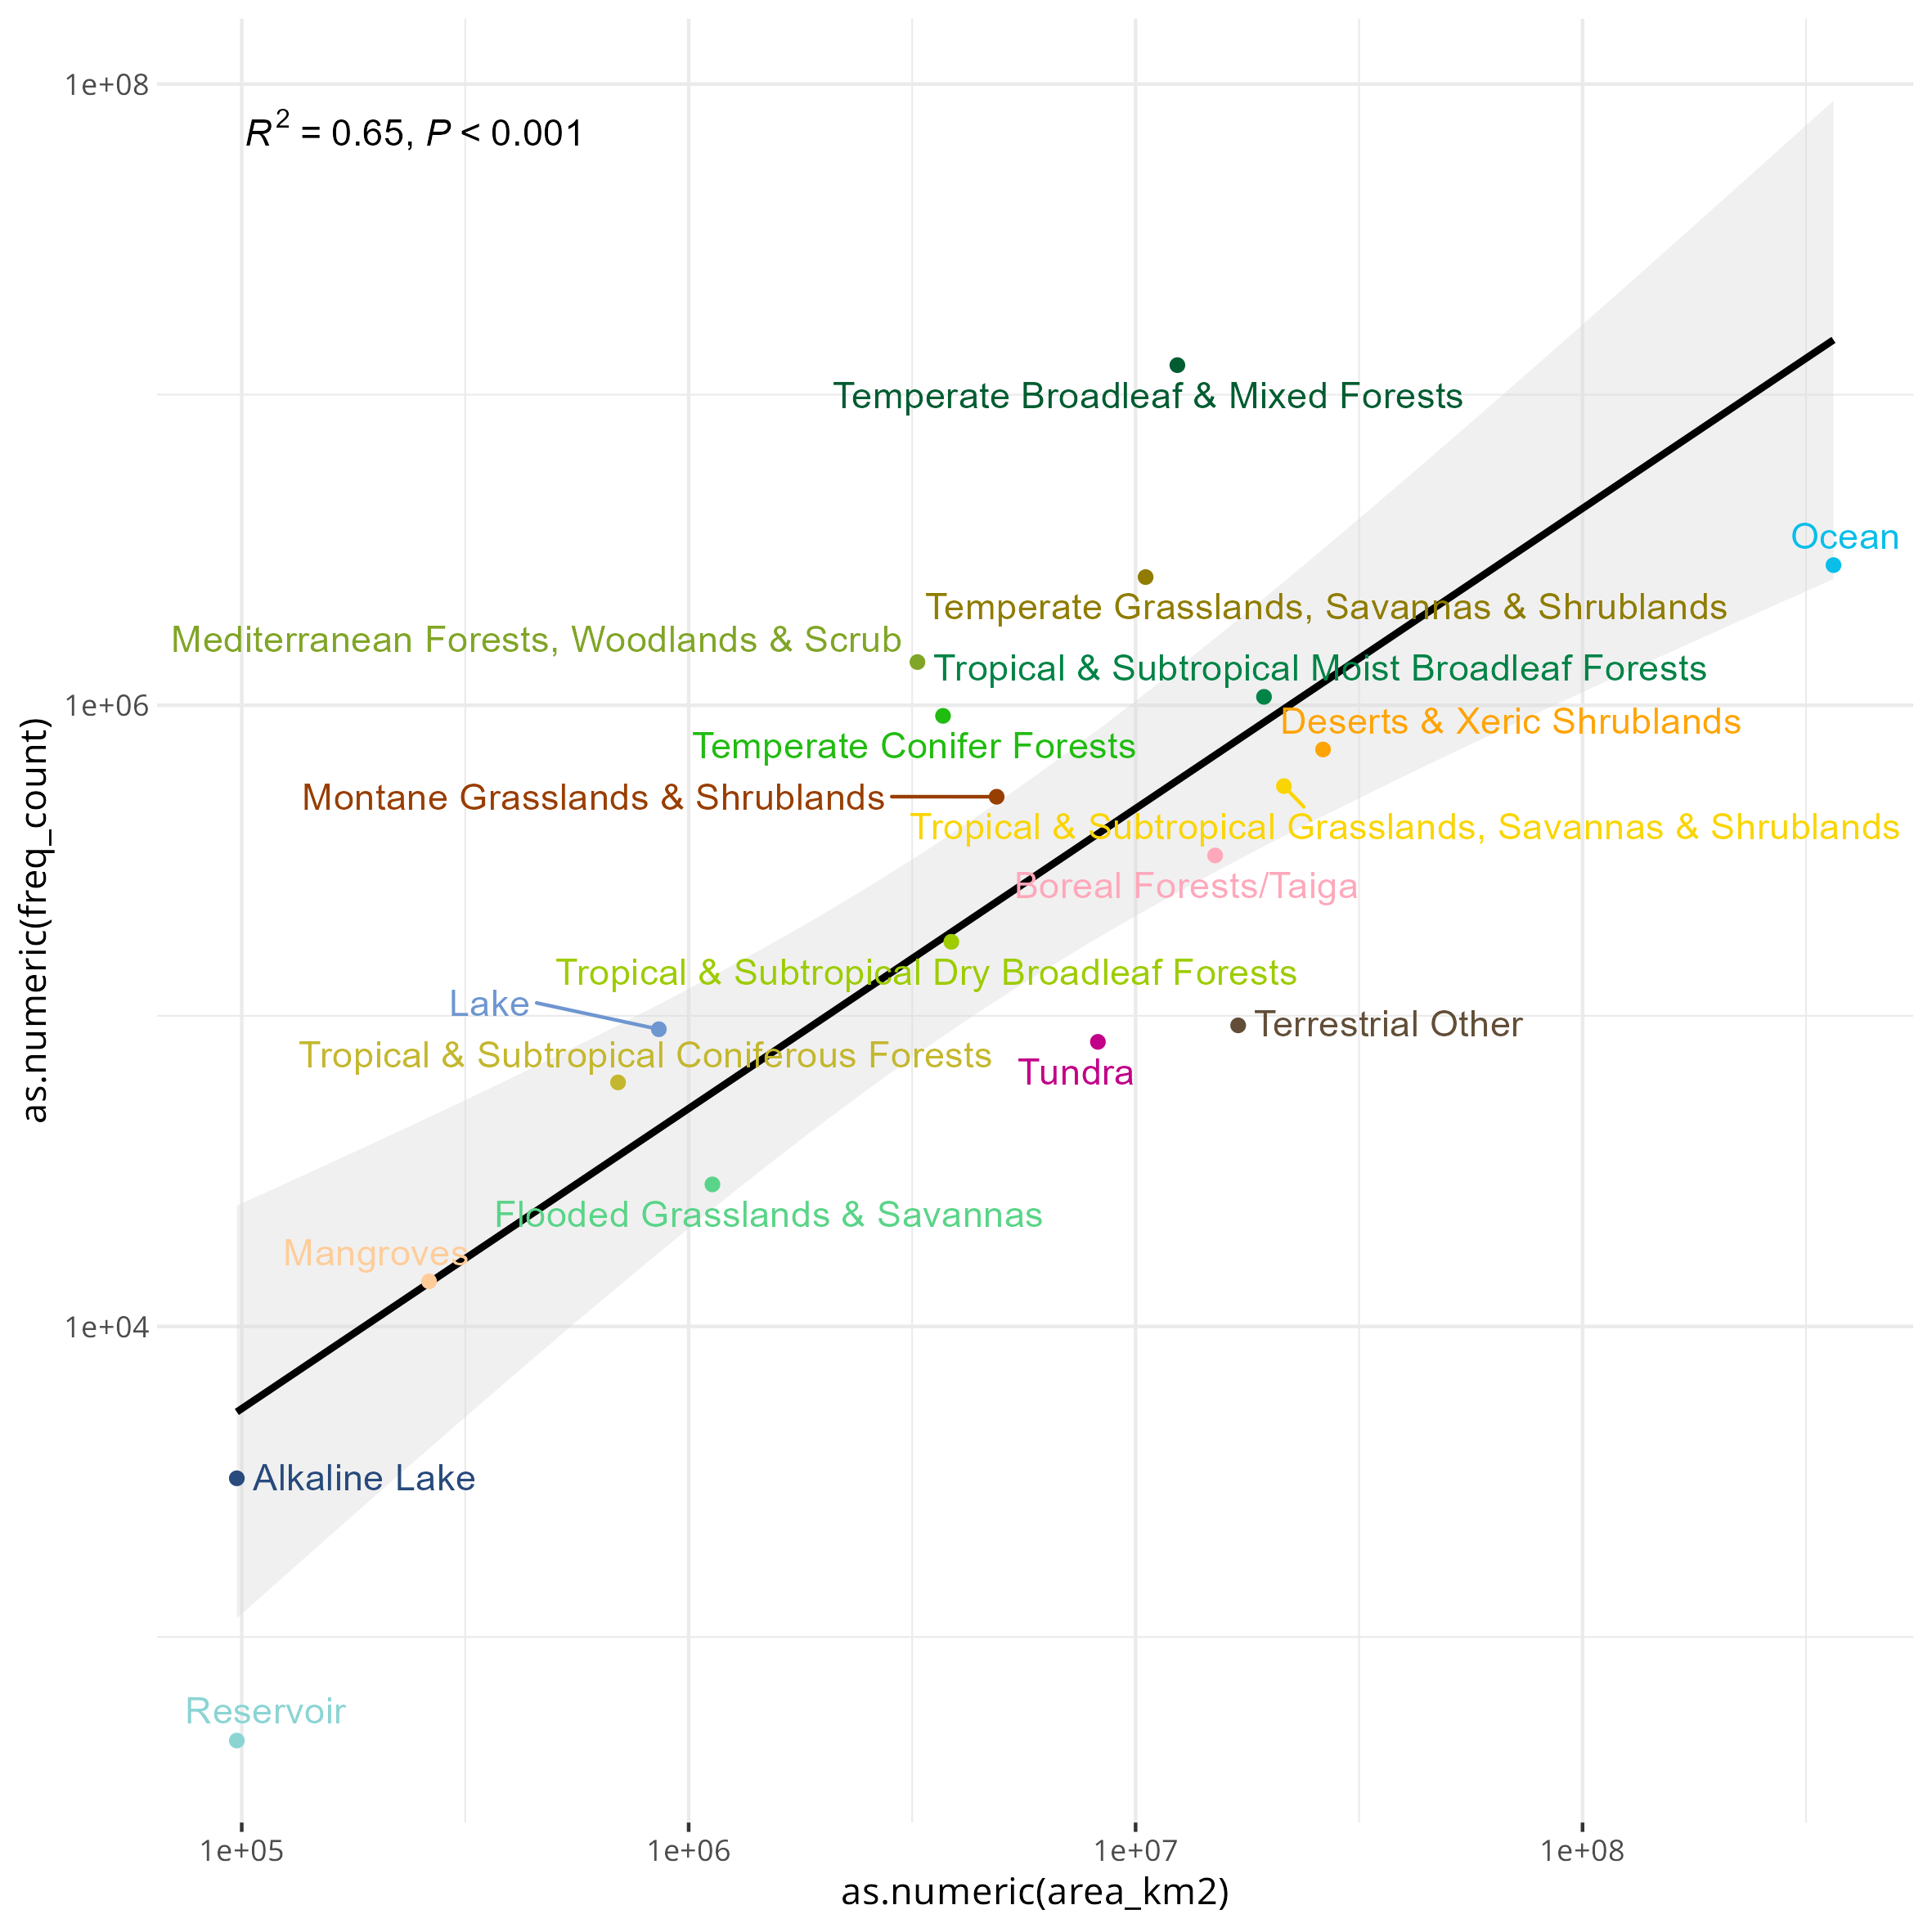
You can also do a first order approximation of which biomes are over/undersampled, normalized to the total km^2 that biome takes up on earth:
Something that I’ve also been thinking about is trying to correlate various indices of socioeconomic development to the SRA as well. I only got a bit of a start on this, but I tried this with the Palma ratio, and the Human Development Index (HDI). Since there are really only country-level estimates for these values, I tried my best to assign each BioSample to a country (which unfortunately excludes the aquatic samples). For the Palma ratio, the lower = more economic equality. For the HDI, the higher the value the more “developed” a country is, taking into account things like education, quality of life.
Theoretically, once could probably generate a multi-variable linear regression to explain sequencing distribution over the world :D.
December 12, 2025 JS